版の配色
1920 × 1080 作品として見る 版そのものを描画 — どの倍率でも字は潰れません 骨格・余白・カラムを重ねた状態
1920 × 1080 作品として見る 版そのものを描画 — どの倍率でも字は潰れません 骨格・余白・カラムを重ねた状態
コピーして貼るか、ファイルに保存して渡す。ネットにつながらない環境には「全部入り」を 1 つ渡せば足りる。
このパネルの中身を、URL の先にあるファイルの中身まで含めて 1 つにまとめた Markdown — 大きいのでファイルで渡す(コピーは 32KB まで)
以下の仕様でスライドを 1 枚作ってください。

- 版面 1920 × 1080
- 余白 上 100 右 140 下 100 左 140

## 文字(版面 1920px に対する px)
title  46px / 700 / 字間 0.01em
subtitle  22px / 500
axisTitle  22px / 700
tick  20px / 500
axisLabel  22px / 500
legend  22px / 500
takeaway  28px / 500
note  20px / 400

## 配色
地 #FFFFFF / 面 #F4F6F9 / 文字 #131820 / 補助 #667183 / 強調 #1F5FA8 / 罫 #DBE1E9

## 外すと崩れる点
- 世帯を所得の低い順に並べ、20%刻みの累積世帯比と累積所得比を対応させる
- 完全平等線は同じ世帯比と所得比を結ぶ。曲線がその線から離れるほど分布が偏っている
- 累積比は0%から100%まで単調に進み、最後は必ず100%で交わる
- 架空データと明記し、実データの対象期間・所得定義・世帯単位を混ぜない

内容は[ここに自分の内容を書く]に置き換えてください。寸法と配色はそのまま守ってください。
正確に再現する場合は、この HTML をそのまま使ってください: https://design-vault.pages.dev/designs/lorenz-curve-household-income-share/pattern.html
/ai/designs/lorenz-curve-household-income-share.json
format: slide-16x9
density: medium
layout:
  kind: axis
  canvas:
    w: 1920
    h: 1080
  margin:
    top: 100
    right: 140
    bottom: 100
    left: 140
type:
  title:
    size: 46
    weight: 700
    tracking: 0.01em
  subtitle:
    size: 22
    weight: 500
  axisTitle:
    size: 22
    weight: 700
  tick:
    size: 20
    weight: 500
  axisLabel:
    size: 22
    weight: 500
  legend:
    size: 22
    weight: 500
  takeaway:
    size: 28
    weight: 500
  note:
    size: 20
    weight: 400
colors:
  ground: "#FFFFFF"
  surface: "#F4F6F9"
  ink: "#131820"
  muted: "#667183"
  accent: "#1F5FA8"
  rule: "#DBE1E9"
rules:
  - 世帯を所得の低い順に並べ、20%刻みの累積世帯比と累積所得比を対応させる
  - 完全平等線は同じ世帯比と所得比を結ぶ。曲線がその線から離れるほど分布が偏っている
  - 累積比は0%から100%まで単調に進み、最後は必ず100%で交わる
  - 架空データと明記し、実データの対象期間・所得定義・世帯単位を混ぜない
{
"format": "slide-16x9",
"density": "medium",
"layout": {
"kind": "axis",
"canvas": {
"w": 1920,
"h": 1080
},
"margin": {
"top": 100,
"right": 140,
"bottom": 100,
"left": 140
}
},
"type": {
"title": {
"size": 46,
"weight": 700,
"tracking": "0.01em"
},
"subtitle": {
"size": 22,
"weight": 500
},
"axisTitle": {
"size": 22,
"weight": 700
},
"tick": {
"size": 20,
"weight": 500
},
"axisLabel": {
"size": 22,
"weight": 500
},
"legend": {
"size": 22,
"weight": 500
},
"takeaway": {
"size": 28,
"weight": 500
},
"note": {
"size": 20,
"weight": 400
}
},
"colors": {
"ground": "#FFFFFF",
"surface": "#F4F6F9",
"ink": "#131820",
"muted": "#667183",
"accent": "#1F5FA8",
"rule": "#DBE1E9"
},
"rules": [
"世帯を所得の低い順に並べ、20%刻みの累積世帯比と累積所得比を対応させる",
"完全平等線は同じ世帯比と所得比を結ぶ。曲線がその線から離れるほど分布が偏っている",
"累積比は0%から100%まで単調に進み、最後は必ず100%で交わる",
"架空データと明記し、実データの対象期間・所得定義・世帯単位を混ぜない"
]
} /designs/lorenz-curve-household-income-share/pattern.html — 版そのものの HTML。書体の部分集合ごと同梱で、開けばこの絵がそのまま出ます。
<!doctype html>
<meta charset="utf-8">
<title>世帯所得の分布 — 上位20%が所得の半分を占める</title>
<meta name="dv-font" content="Zen Kaku Gothic New:400;500;700">
<link rel="stylesheet" href="./font.css">
<style>
  :root {
    --ground: #FFFFFF;
    --surface: #F4F6F9;
    --ink: #131820;
    --muted: #667183;
    --accent: #1F5FA8;
    --rule: #DBE1E9;
  }

  * { box-sizing: border-box; margin: 0; }
  html, body { width: 1920px; height: 1080px; }
  body { font-family: "Zen Kaku Gothic New", "Hiragino Sans", sans-serif; }
  .artboard { width: 1920px; height: 1080px; padding: 100px 140px; background: var(--ground); color: var(--ink); }
  .content { width: 100%; height: 100%; position: relative; }
  .figure { position: absolute; left: -140px; top: -100px; width: 1920px; height: 1080px; }
</style>

<div class="artboard" data-artboard>
  <div class="content" data-content>
    <svg class="figure" width="1920" height="1080" viewBox="0 0 1920 1080" xmlns="http://www.w3.org/2000/svg" role="img" aria-label="架空データのLorenz曲線。下位80%の世帯が所得の50%を得ており、上位20%が残りの50%を占める。">
      <style>
        .figure { font-family: "Zen Kaku Gothic New", "Hiragino Sans", sans-serif; }
        .ground { fill: var(--ground); }
        .ink { fill: var(--ink); }
        .muted { fill: var(--muted); }
        .rule { stroke: var(--rule); }
        .title { font-size: 46px; font-weight: 700; letter-spacing: .01em; }
        .subtitle { font-size: 22px; font-weight: 500; }
        .axis-title { font-size: 22px; font-weight: 700; }
        .tick { font-size: 20px; font-weight: 500; }
        .legend { font-size: 22px; font-weight: 500; }
        .takeaway { font-size: 28px; font-weight: 500; }
        .note { font-size: 20px; font-weight: 400; }
        .equality { fill: none; stroke: var(--muted); stroke-width: 4; stroke-dasharray: 12 10; }
        .lorenz { fill: none; stroke: var(--accent); stroke-width: 8; stroke-linejoin: round; stroke-linecap: round; }
        .point { fill: var(--ground); stroke: var(--accent); stroke-width: 5; }
      </style>
      <rect class="ground" width="1920" height="1080"/>

      <text class="ink title" data-type="title" x="140" y="153">世帯所得の分布 — 上位20%が所得の半分を占める</text>
      <text class="muted subtitle" data-type="subtitle" x="140" y="201">世帯を所得の低い順に並べた累積比 / 各20%の世帯ごとに所得シェアを集計</text>
      <line class="rule" x1="140" y1="238" x2="1780" y2="238" stroke-width="2"/>

      <text class="ink axis-title" data-type="axisTitle" x="930" y="300" text-anchor="middle">完全平等線からの離れ方で、所得の偏りを見る</text>
      <g class="rule" fill="none" stroke-width="1.5">
        <line x1="380" y1="320" x2="380" y2="755"/>
        <line x1="598" y1="320" x2="598" y2="755"/>
        <line x1="816" y1="320" x2="816" y2="755"/>
        <line x1="1034" y1="320" x2="1034" y2="755"/>
        <line x1="1252" y1="320" x2="1252" y2="755"/>
        <line x1="1470" y1="320" x2="1470" y2="755"/>
        <line x1="380" y1="755" x2="1470" y2="755"/>
        <line x1="380" y1="668" x2="1470" y2="668"/>
        <line x1="380" y1="581" x2="1470" y2="581"/>
        <line x1="380" y1="494" x2="1470" y2="494"/>
        <line x1="380" y1="407" x2="1470" y2="407"/>
        <line x1="380" y1="320" x2="1470" y2="320"/>
      </g>

      <!-- Each step represents one equal 20% household group. Values are cumulative shares. -->
      <path class="equality" d="M380 755 L1470 320"/>
      <path class="lorenz" d="M380 755 L598 733.25 L816 694.1 L1034 637.55 L1252 537.5 L1470 320"/>
      <g>
        <circle class="point" cx="380" cy="755" r="8"/>
        <circle class="point" cx="598" cy="733.25" r="8"/>
        <circle class="point" cx="816" cy="694.1" r="8"/>
        <circle class="point" cx="1034" cy="637.55" r="8"/>
        <circle class="point" cx="1252" cy="537.5" r="8"/>
        <circle class="point" cx="1470" cy="320" r="8"/>
      </g>

      <g class="muted tick" text-anchor="middle" dominant-baseline="central">
        <text data-type="tick" x="380" y="785">0%</text>
        <text x="598" y="785">20%</text>
        <text x="816" y="785">40%</text>
        <text x="1034" y="785">60%</text>
        <text x="1252" y="785">80%</text>
        <text x="1470" y="785">100%</text>
        <text x="340" y="755">0%</text>
        <text x="340" y="668">20%</text>
        <text x="340" y="581">40%</text>
        <text x="340" y="494">60%</text>
        <text x="340" y="407">80%</text>
        <text x="340" y="320">100%</text>
      </g>
      <text class="ink legend" data-type="axisLabel" x="925" y="835" text-anchor="middle">累積世帯の割合(所得の低い順)</text>
      <text class="muted legend" x="140" y="300">累積所得の割合</text>

      <line x1="555" y1="882" x2="615" y2="882" stroke="var(--muted)" stroke-width="4" stroke-dasharray="12 10"/>
      <text class="muted legend" data-type="legend" x="630" y="882" dominant-baseline="central">完全平等線</text>
      <line x1="1005" y1="882" x2="1065" y2="882" stroke="var(--accent)" stroke-width="8" stroke-linecap="round"/>
      <circle class="point" cx="1035" cy="882" r="7"/>
      <text class="ink legend" x="1080" y="882" dominant-baseline="central">架空の世帯所得</text>

      <text class="ink takeaway" data-type="takeaway" x="960" y="938" text-anchor="middle">下位80%が所得の50%を受け取り、上位20%が残りの半分を占める</text>
      <line class="rule" x1="140" y1="974" x2="1780" y2="974" stroke-width="1"/>
      <text class="muted note" data-type="note" x="140" y="1013">架空データ。格差を比較するには、対象期間・所得定義・世帯単位を揃える。</text>
    </svg>
  </div>
</div>
/designs/lorenz-curve-household-income-share/font.css — 全部入りには入れていない
/* dv-subset v2 — generated by scripts/subset-font.mjs. Do not edit.
 * font    Zen Kaku Gothic New 400;500;700
 * chars   88 (b47d8023b8e6bcae)
 *
 * pattern.html の文字だけを含む部分集合。描画時に外部へ取りに行かないよう同梱する。
 * 版の文字を変えたら取り直すこと — 忘れると足りない字が豆腐になる。
 * その取り忘れは pattern-entries.test.ts が上の指紋で検出する。
 */

@font-face {
  font-family: 'Zen Kaku Gothic New';
  font-style: normal;
  font-weight: 400;
  font-display: block;
  src: url(./font-0.woff2) format('woff2');
  unicode-range: U+25, U+2f-32, U+34-36, U+38, U+2014, U+3001-3002, U+3044, U+3048, U+304b-304c, U+3051-3054, U+3059-305a, U+305f-3060, U+3066-3069, U+306b, U+306e-3070, U+3078-3079, U+3081, U+3089-308c, U+3092, U+3099, U+30a2, U+30a7, U+30b7-30b8, U+30bf-30c0, U+30c6-30c7, U+30fb-30fc, U+4e0a-4e0b, U+4e16, U+4e26, U+4f4d-4f4e, U+504f, U+5168, U+5206, U+5272, U+534a, U+5358, U+5360, U+53d6-53d7, U+5404, U+5408, U+5b8c, U+5b9a, U+5bfe, U+5dee, U+5e03, U+5e2f, U+5e73, U+5f97, U+6240, U+63c3, U+65b9, U+671f, U+67b6, U+683c, U+6b8b, U+6bd4, U+7a4d, U+7a7a, U+7b49, U+7d2f, U+7dda, U+7fa9, U+898b, U+8a08, U+8c61, U+8f03, U+9593, U+96c6, U+96e2, U+9806, U+ff08-ff09;
}
@font-face {
  font-family: 'Zen Kaku Gothic New';
  font-style: normal;
  font-weight: 500;
  font-display: block;
  src: url(./font-1.woff2) format('woff2');
  unicode-range: U+25, U+2f-32, U+34-36, U+38, U+2014, U+3001-3002, U+3044, U+3048, U+304b-304c, U+3051-3054, U+3059-305a, U+305f-3060, U+3066-3069, U+306b, U+306e-3070, U+3078-3079, U+3081, U+3089-308c, U+3092, U+3099, U+30a2, U+30a7, U+30b7-30b8, U+30bf-30c0, U+30c6-30c7, U+30fb-30fc, U+4e0a-4e0b, U+4e16, U+4e26, U+4f4d-4f4e, U+504f, U+5168, U+5206, U+5272, U+534a, U+5358, U+5360, U+53d6-53d7, U+5404, U+5408, U+5b8c, U+5b9a, U+5bfe, U+5dee, U+5e03, U+5e2f, U+5e73, U+5f97, U+6240, U+63c3, U+65b9, U+671f, U+67b6, U+683c, U+6b8b, U+6bd4, U+7a4d, U+7a7a, U+7b49, U+7d2f, U+7dda, U+7fa9, U+898b, U+8a08, U+8c61, U+8f03, U+9593, U+96c6, U+96e2, U+9806, U+ff08-ff09;
}
@font-face {
  font-family: 'Zen Kaku Gothic New';
  font-style: normal;
  font-weight: 700;
  font-display: block;
  src: url(./font-2.woff2) format('woff2');
  unicode-range: U+25, U+2f-32, U+34-36, U+38, U+2014, U+3001-3002, U+3044, U+3048, U+304b-304c, U+3051-3054, U+3059-305a, U+305f-3060, U+3066-3069, U+306b, U+306e-3070, U+3078-3079, U+3081, U+3089-308c, U+3092, U+3099, U+30a2, U+30a7, U+30b7-30b8, U+30bf-30c0, U+30c6-30c7, U+30fb-30fc, U+4e0a-4e0b, U+4e16, U+4e26, U+4f4d-4f4e, U+504f, U+5168, U+5206, U+5272, U+534a, U+5358, U+5360, U+53d6-53d7, U+5404, U+5408, U+5b8c, U+5b9a, U+5bfe, U+5dee, U+5e03, U+5e2f, U+5e73, U+5f97, U+6240, U+63c3, U+65b9, U+671f, U+67b6, U+683c, U+6b8b, U+6bd4, U+7a4d, U+7a7a, U+7b49, U+7d2f, U+7dda, U+7fa9, U+898b, U+8a08, U+8c61, U+8f03, U+9593, U+96c6, U+96e2, U+9806, U+ff08-ff09;
}
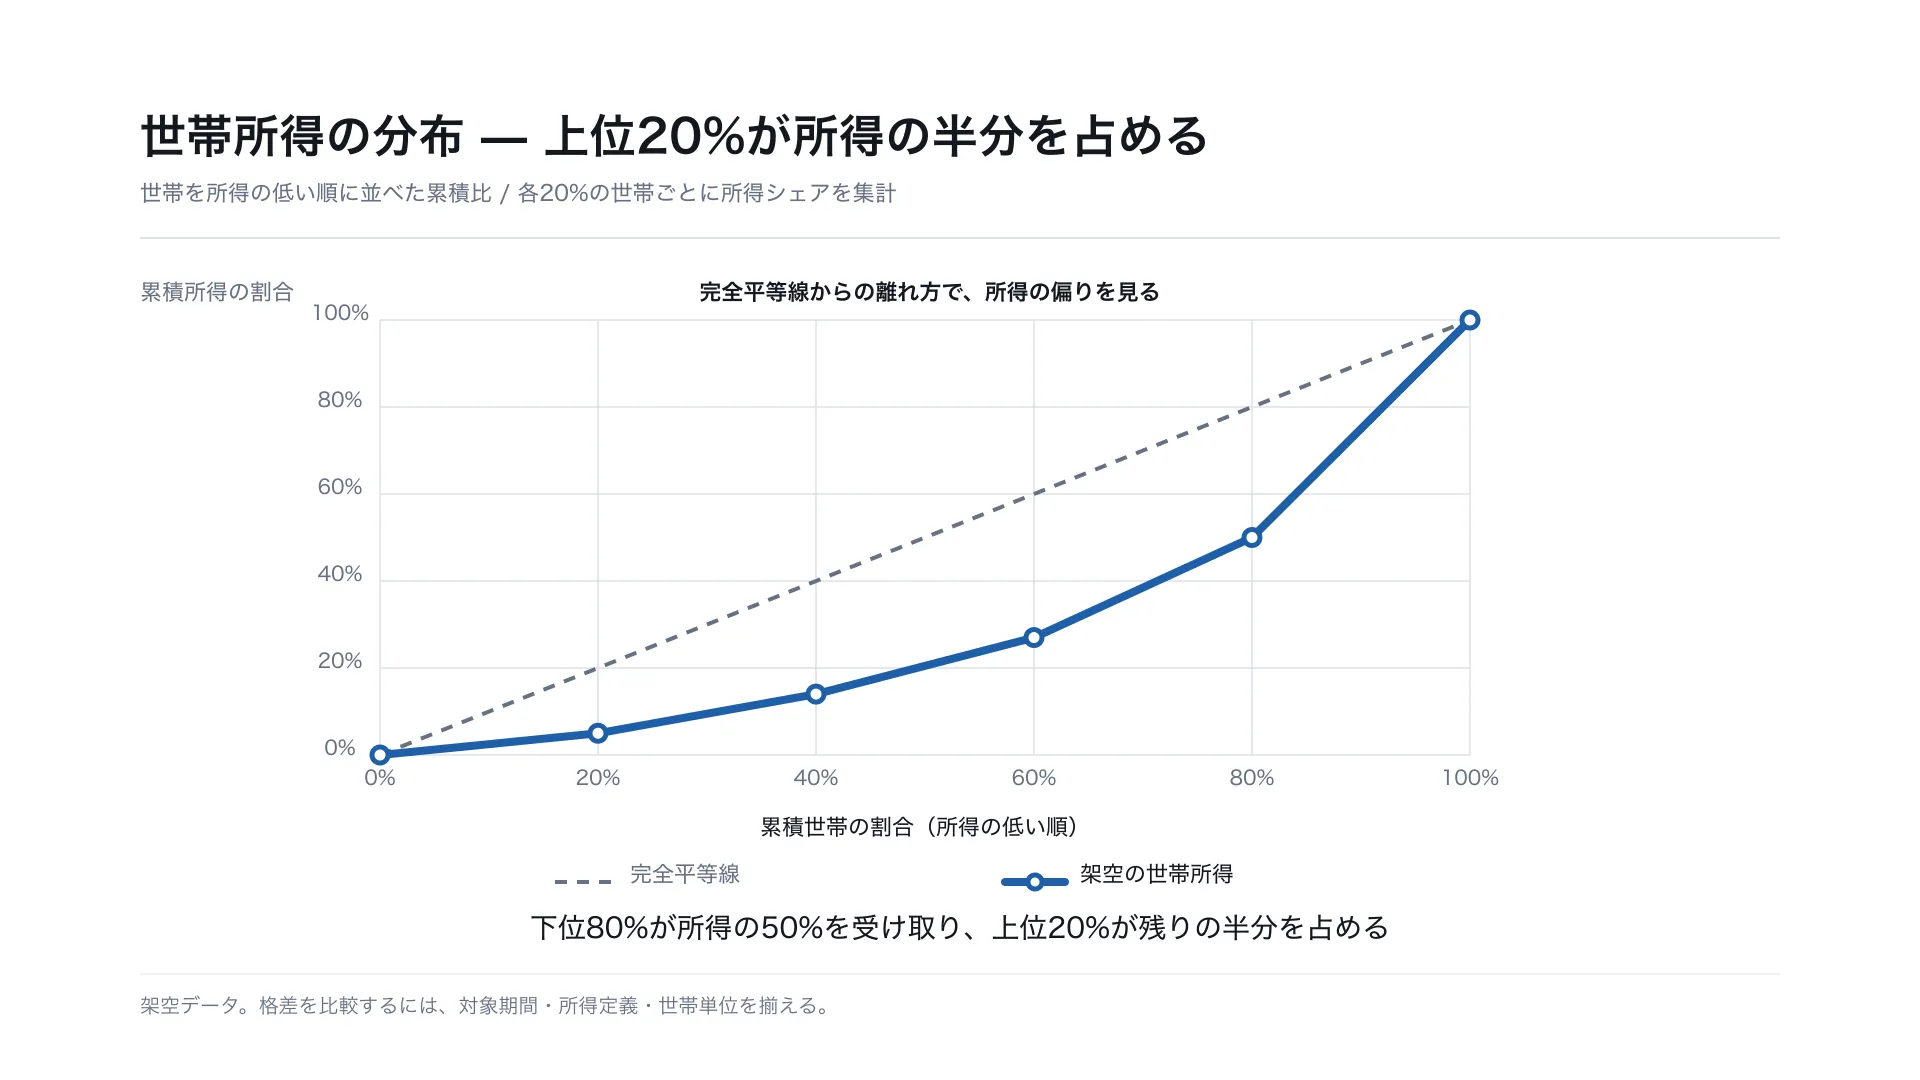
世帯を所得順に並べたとき、累積所得の分布は完全平等線からどれだけ離れるか。
横軸は累積世帯比、縦軸は累積所得比。破線は両比率が一致する完全平等線で、実線は所得順に 積み上げた架空データである。上位20%が所得の50%を占めるため、下位80%の累積点は50%になる。
散布図のように異なる項目どうしの相関を示す図ではない。等しい世帯比を区切りとして所得シェアを 積み上げ、対角線からの離れ具合を分布の偏りとして読む。