作品として見る 生成された文書そのもの — 切り替えも開閉もそのまま動きます
作品として見る 生成された文書そのもの — 切り替えも開閉もそのまま動きます
コピーして貼るか、ファイルに保存して渡す。ネットにつながらない環境には「全部入り」を 1 つ渡せば足りる。
このパネルの中身を、URL の先にあるファイルの中身まで含めて 1 つにまとめた Markdown — 大きいのでファイルで渡す(コピーは 32KB まで)
「ROC曲線・閾値選定」でHTML資料を作ってください。この型は実行できるので、版面を組み直す必要はありません — 必要なのは中身です。

## この型がすること
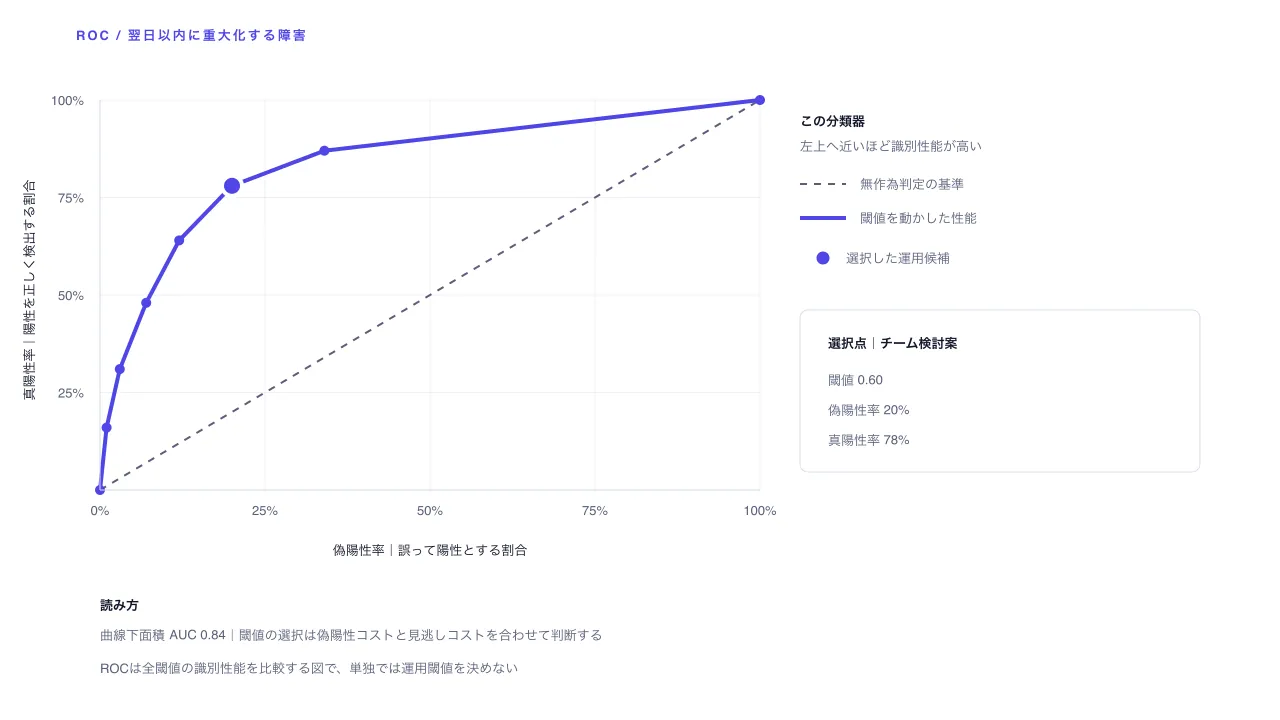
分類閾値ごとの偽陽性率と真陽性率をROC平面へ置き、無作為判定の基準と識別性能、運用候補の位置を比較する。

## 渡す必要があるもの
- 陽性クラスを定義し、評価データ上の偽陽性率・真陽性率を分類閾値の降順で入力する。割合は0〜1。
- ROC曲線は(0,0)と(1,1)の両端を含め、運用候補の点IDを一つ選ぶ。閾値選定には誤検知・見逃しのコストを併記する。

## 入力の形
- `title` — string — 分類器の識別性能について伝える見出し
- `subtitle` — string? — 対象期間・評価データ・陽性クラスの前提
- `positiveClass` — string — 検出対象とする陽性クラス
- `selectedPointId` — string — 運用候補として選んだ閾値点のID
- `points` — array (id, label, threshold, falsePositiveRate, truePositiveRate) — 閾値降順4〜12点。両端は(0,0)と(1,1)。率は0〜1で非減少。曲線下面積は図示時に台形積分

入力の機械可読な検証は schema.ts が持ちます。足りない入力は推測せず質問してください。

## 向かない場合
- 規格限界への適合、時系列の工程安定性、または選定候補の最終運用判断を単独で確定したい場合。
- 軸が偽陽性率・真陽性率ではない一般の二変量関係を示す場合は散布図を使う。

## 作り方
入力を JSON にまとめ、次を実行します。

```bash
node scripts/render.mjs roc-curve <入力.json> --theme ink -o out.html
```

出力は 1 ファイルで完結し、外部から何も読み込みません。

## 原本
- https://design-vault.pages.dev/designs/roc-curve/source/template.tsx
- https://design-vault.pages.dev/designs/roc-curve/source/schema.ts
- https://design-vault.pages.dev/designs/roc-curve/source/sample-data.json
- https://design-vault.pages.dev/designs/roc-curve/sample.html
テンプレート・入力スキーマ・サンプルデータ・メタ情報。この文書はこの 4 つから生成されています。 生成された文書
/designs/roc-curve/source/template.tsx
import type { Props } from "./schema";

const CSS = String.raw`
.asset{font-family:var(--font-sans);color:var(--color-on-surface);background:var(--color-surface);max-width:var(--container-slide);margin:auto;padding:2.5rem 3rem;line-height:1.5}.asset *{box-sizing:border-box}.asset h1{font-size:var(--text-h1);line-height:1.3;margin:0}.asset .subtitle{color:var(--color-secondary);margin:.6rem 0 1.25rem}.asset .eyebrow{font:600 var(--text-label) var(--font-mono);letter-spacing:.1em;color:var(--color-tertiary)}.asset .plot{display:block;width:100%;height:auto}.asset .plot text{font-family:var(--font-sans);font-size:13px;fill:var(--color-secondary)}.asset .plot .ink{fill:var(--color-on-surface)}.asset .plot .axis{stroke:var(--color-outline);stroke-width:1}.asset .plot .grid{stroke:var(--color-outline);stroke-width:1;opacity:.48}.asset .plot .curve{fill:none;stroke:var(--color-tertiary);stroke-width:4;stroke-linejoin:round;stroke-linecap:round}.asset .plot .chance{stroke:var(--color-secondary);stroke-width:2;stroke-dasharray:7 7}.asset .plot .point{fill:var(--color-tertiary)}.asset .plot .selected{fill:var(--color-primary);stroke:var(--color-surface);stroke-width:4}.asset .summary{display:grid;grid-template-columns:repeat(3,minmax(0,1fr));gap:1rem;margin:1rem 0 1.5rem}.asset .metric{padding:1rem;background:var(--color-surface-subtle);border-top:3px solid var(--color-tertiary);min-width:0}.asset .metric dt{font-size:var(--text-label);color:var(--color-secondary)}.asset .metric dd{margin:.25rem 0 0;font:700 var(--text-h2) var(--font-mono);overflow-wrap:anywhere}.asset .ledger{border-collapse:collapse;width:100%;font-variant-numeric:tabular-nums}.asset .ledger th,.asset .ledger td{text-align:left;vertical-align:top;padding:.65rem .75rem;border-bottom:1px solid var(--color-outline);overflow-wrap:anywhere}.asset .ledger th{color:var(--color-secondary)}.asset .ledger tr[data-selected=true]{background:var(--color-tertiary-container)}.asset .ledger .mono{font-family:var(--font-mono)}.asset details{margin-top:1rem}.asset summary{cursor:pointer;min-height:2.75rem;padding:.5rem 0;color:var(--color-secondary)}.asset .note{border-left:3px solid var(--color-outline);padding:.75rem 1rem;color:var(--color-secondary)}
@media(max-width:640px){.asset{padding:1.5rem 1rem}.asset h1{font-size:var(--text-h2)}.asset .summary{grid-template-columns:1fr}.asset .ledger,.asset .ledger tbody,.asset .ledger tr,.asset .ledger td{display:block}.asset .ledger thead{display:none}.asset .ledger tr{padding:.65rem 0;border-bottom:1px solid var(--color-outline)}.asset .ledger td{display:grid;grid-template-columns:8rem minmax(0,1fr);gap:.75rem;border:0;padding:.2rem 0}.asset .ledger td:before{content:attr(data-label);font-size:var(--text-label);color:var(--color-secondary)}}
`;

const fmtRate = (value: number) => `${(value * 100).toFixed(0)}%`;
const pathFor = (points: Props["points"]) => points.map((point, index) => `${index ? "L" : "M"} ${100 + point.falsePositiveRate * 660} ${490 - point.truePositiveRate * 390}`).join(" ");
const auc = (points: Props["points"]) => points.slice(1).reduce((sum, point, index) => {
  const previous = points[index];
  return sum + (point.falsePositiveRate - previous.falsePositiveRate) * (point.truePositiveRate + previous.truePositiveRate) / 2;
}, 0);

export default function Template(d: Props) {
  const selected = d.points.find(point => point.id === d.selectedPointId)!;
  const area = auc(d.points);
  const tick = [0, .25, .5, .75, 1];
  return <section className="asset asset-roc-curve">
    <style>{CSS}</style>
    <header>
      <p className="eyebrow">ROC CURVE / THRESHOLD SELECTION</p>
      <h1>{d.title}</h1>
      {d.subtitle && <p className="subtitle">{d.subtitle}</p>}
    </header>
    <svg className="plot" data-layout-still="true" width="1280" height="720" viewBox="0 0 1280 720" role="img" aria-labelledby="roc-title roc-desc" fontFamily="sans-serif" fontSize="13" fill="var(--color-secondary)">
      <title id="roc-title">{d.title}</title>
      <desc id="roc-desc">陽性クラス {d.positiveClass} のROC曲線。選択閾値 {selected.threshold.toFixed(2)} の偽陽性率は {fmtRate(selected.falsePositiveRate)}、真陽性率は {fmtRate(selected.truePositiveRate)}、曲線下面積は {area.toFixed(2)}。</desc>
      <rect width="1280" height="720" fill="var(--color-surface)" />
      <text x="76" y="40" fontSize="13" fontWeight="700" letterSpacing="2" fill="var(--color-tertiary)">ROC / {d.positiveClass}</text>
      {tick.map((value, index) => {
        const px = 100 + value * 660;
        const py = 490 - value * 390;
        return <g key={index}>
          <line x1="100" y1={py} x2="760" y2={py} stroke="var(--color-outline)" strokeWidth="1" opacity=".48" />
          <line x1={px} y1="100" x2={px} y2="490" stroke="var(--color-outline)" strokeWidth="1" opacity=".48" />
          {value > 0 && <text x="84" y={py + 5} textAnchor="end">{fmtRate(value)}</text>}
          <text x={px} y="515" textAnchor="middle">{fmtRate(value)}</text>
        </g>;
      })}
      <line x1="100" y1="490" x2="760" y2="100" stroke="var(--color-secondary)" strokeWidth="2" strokeDasharray="7 7" />
      <path d={pathFor(d.points)} fill="none" stroke="var(--color-tertiary)" strokeWidth="4" strokeLinejoin="round" strokeLinecap="round" />
      {d.points.map(point => <circle key={point.id} cx={100 + point.falsePositiveRate * 660} cy={490 - point.truePositiveRate * 390} r={point.id === selected.id ? 10 : 5} fill="var(--color-tertiary)" stroke={point.id === selected.id ? "var(--color-surface)" : "none"} strokeWidth="4" />)}
      <line x1="100" y1="490" x2="760" y2="490" stroke="var(--color-outline)" strokeWidth="1" />
      <line x1="100" y1="100" x2="100" y2="490" stroke="var(--color-outline)" strokeWidth="1" />
      <text x="430" y="555" textAnchor="middle" fill="var(--color-on-surface)">偽陽性率|誤って陽性とする割合</text>
      <text x="34" y="290" textAnchor="middle" transform="rotate(-90 34 290)" fill="var(--color-on-surface)">真陽性率|陽性を正しく検出する割合</text>
      <text x="800" y="126" fontWeight="700" fill="var(--color-on-surface)">この分類器</text>
      <text x="800" y="151">左上へ近いほど識別性能が高い</text>
      <line x1="800" y1="184" x2="846" y2="184" stroke="var(--color-secondary)" strokeWidth="2" strokeDasharray="7 7" />
      <text x="860" y="189">無作為判定の基準</text>
      <line x1="800" y1="218" x2="846" y2="218" stroke="var(--color-tertiary)" strokeWidth="4" />
      <text x="860" y="223">閾値を動かした性能</text>
      <circle cx="823" cy="258" r="8" fill="var(--color-tertiary)" stroke="var(--color-surface)" strokeWidth="3" />
      <text x="846" y="263">選択した運用候補</text>
      <rect x="800" y="310" width="400" height="162" rx="8" fill="var(--color-surface)" stroke="var(--color-outline)" />
      <text x="828" y="348" fontWeight="700" fill="var(--color-on-surface)">選択点|{selected.label}</text>
      <text x="828" y="385">閾値 {selected.threshold.toFixed(2)}</text>
      <text x="828" y="415">偽陽性率 {fmtRate(selected.falsePositiveRate)}</text>
      <text x="828" y="445">真陽性率 {fmtRate(selected.truePositiveRate)}</text>
      <text x="100" y="610" fontWeight="700" fill="var(--color-on-surface)">読み方</text>
      <text x="100" y="640">曲線下面積 AUC {area.toFixed(2)}|閾値の選択は偽陽性コストと見逃しコストを合わせて判断する</text>
      <text x="100" y="673">ROCは全閾値の識別性能を比較する図で、単独では運用閾値を決めない</text>
    </svg>
    <dl className="summary">
      <div className="metric"><dt>ROC曲線下面積</dt><dd>{area.toFixed(2)} / 1.00</dd></div>
      <div className="metric"><dt>選択閾値</dt><dd>{selected.threshold.toFixed(2)}</dd></div>
      <div className="metric"><dt>選択点の真陽性率 / 偽陽性率</dt><dd>{fmtRate(selected.truePositiveRate)} / {fmtRate(selected.falsePositiveRate)}</dd></div>
    </dl>
    <p className="note">ROC曲線は閾値ごとの識別性能を比較します。実運用の閾値は、誤検知と見逃しの業務コストを合わせて決めてください。</p>
    <details open>
      <summary>全閾値点と率の対応を確認({d.points.length}点)</summary>
      <table className="ledger"><thead><tr><th>候補</th><th>閾値</th><th>偽陽性率</th><th>真陽性率</th></tr></thead>
        <tbody>{d.points.map(point => <tr key={point.id} data-roc-point={point.id} data-selected={point.id === selected.id}>
          <td data-label="候補">{point.label}{point.id === selected.id ? "(選択)" : ""}</td>
          <td data-label="閾値" className="mono">{point.threshold.toFixed(2)}</td>
          <td data-label="偽陽性率" className="mono">{fmtRate(point.falsePositiveRate)}</td>
          <td data-label="真陽性率" className="mono">{fmtRate(point.truePositiveRate)}</td>
        </tr>)}</tbody>
      </table>
    </details>
  </section>;
}
/designs/roc-curve/source/schema.ts
import { z } from "zod";

const text = z.string().trim().min(1).max(160);
const id = z.string().trim().min(1).max(24);
const label = z.string().trim().min(1).max(64);
const rate = z.number().finite().min(0).max(1);

export const schema = z.object({
  title: text.describe("分類器の識別性能について伝える見出し"),
  subtitle: text.optional().describe("対象期間・評価データ・陽性クラスの前提"),
  positiveClass: label.describe("検出対象とする陽性クラス"),
  selectedPointId: id.describe("運用候補として選んだ閾値点のID"),
  points: z.array(z.object({
    id: id.describe("閾値点の一意なID"),
    label: label.describe("閾値の業務上の意味または運用候補名"),
    threshold: rate.describe("陽性判定に使う分類スコアの閾値。高い順に並べる"),
    falsePositiveRate: rate.describe("偽陽性率。横軸に使う0〜1の比率"),
    truePositiveRate: rate.describe("真陽性率。縦軸に使う0〜1の比率"),
  }).strict()).min(4).max(12).describe("閾値を高い順に走査したROC上の点。両端を含める"),
}).strict().superRefine((data, ctx) => {
  const ids = data.points.map(point => point.id);
  if (new Set(ids).size !== ids.length) {
    ctx.addIssue({ code: "custom", path: ["points"], message: "閾値点IDは一意" });
  }
  const selected = data.points.find(point => point.id === data.selectedPointId);
  if (!selected) {
    ctx.addIssue({ code: "custom", path: ["selectedPointId"], message: "選択点はpointsに存在する" });
  }
  if (data.points.length >= 2) {
    const first = data.points[0];
    const last = data.points[data.points.length - 1];
    if (first.falsePositiveRate !== 0 || first.truePositiveRate !== 0 || last.falsePositiveRate !== 1 || last.truePositiveRate !== 1) {
      ctx.addIssue({ code: "custom", path: ["points"], message: "ROCは(0,0)から(1,1)までの両端点を含む" });
    }
    for (let index = 1; index < data.points.length; index += 1) {
      const previous = data.points[index - 1];
      const current = data.points[index];
      if (current.threshold >= previous.threshold) {
        ctx.addIssue({ code: "custom", path: ["points", index, "threshold"], message: "閾値は重複せず高い順に並ぶ" });
      }
      if (current.falsePositiveRate < previous.falsePositiveRate || current.truePositiveRate < previous.truePositiveRate) {
        ctx.addIssue({ code: "custom", path: ["points", index], message: "偽陽性率と真陽性率は閾値低下に伴い非減少" });
      }
    }
  }
});

export type Props = z.infer<typeof schema>;
/designs/roc-curve/source/meta.yaml
id: roc-curve
name:
  ja: ROC曲線・閾値選定
  en: ROC Curve and Threshold Selection
purpose:
  ja: 分類閾値ごとの偽陽性率と真陽性率をROC平面へ置き、無作為判定の基準と識別性能、運用候補の位置を比較する。
  en: Plot false-positive and true-positive rates across classifier thresholds to compare discrimination with chance and inspect a selected operating candidate.
status: published
still: ./still.png
category: analysis
catalogOrder: 805
jobs:
  - compare-choose
  - prioritize-diagnose
useCases:
  - prioritization
  - kpi
layoutKinds:
  - matrix
tags:
  - roc-curve
  - classifier-evaluation
  - threshold-selection
  - offline
  - responsive
whenToUse:
  - ja: 分類スコアの閾値を動かしたとき、陽性の見逃しと誤検知がどう変わるかを評価する。
    en: Use to compare how missed positives and false alarms change as a classifier threshold moves.
  - ja: 無作為判定の対角線を基準にモデル識別力を読み、業務コストを踏まえた候補点を話し合う。
    en: Use the chance diagonal to read discrimination and discuss candidate thresholds against operational costs.
avoidWhen:
  - ja: 規格限界への適合、時系列の工程安定性、または選定候補の最終運用判断を単独で確定したい場合。
    en: Do not use to decide specification compliance, process stability, or an operating threshold without cost context.
  - ja: 軸が偽陽性率・真陽性率ではない一般の二変量関係を示す場合は散布図を使う。
    en: Use a scatter plot for general two-variable relationships that are not threshold-swept classification rates.
requiredInputs:
  - ja: 陽性クラスを定義し、評価データ上の偽陽性率・真陽性率を分類閾値の降順で入力する。割合は0〜1。
    en: Define the positive class and supply false-positive and true-positive rates in descending threshold order, as fractions from zero to one.
  - ja: ROC曲線は(0,0)と(1,1)の両端を含め、運用候補の点IDを一つ選ぶ。閾値選定には誤検知・見逃しのコストを併記する。
    en: Include the (0,0) and (1,1) endpoints, select one operating candidate by point ID, and consider false-alarm and miss costs separately.
relatedLayouts:
  - scatter-relationship
  - control-chart
dataSchema:
  title: string — 分類器の識別性能について伝える見出し
  subtitle: string? — 対象期間・評価データ・陽性クラスの前提
  positiveClass: string — 検出対象とする陽性クラス
  selectedPointId: string — 運用候補として選んだ閾値点のID
  points: array (id, label, threshold, falsePositiveRate, truePositiveRate) — 閾値降順4〜12点。両端は(0,0)と(1,1)。率は0〜1で非減少。曲線下面積は図示時に台形積分
sources: []
/designs/roc-curve/source/sample-data.json
{
  "title": "障害検知の感度と誤検知のバランスを確認する",
  "subtitle": "架空サンプル|本番投入前の分類器評価データ",
  "positiveClass": "翌日以内に重大化する障害",
  "selectedPointId": "p06",
  "points": [
    { "id": "p01", "label": "最も厳格", "threshold": 1, "falsePositiveRate": 0, "truePositiveRate": 0 },
    { "id": "p02", "label": "重大度優先", "threshold": 0.92, "falsePositiveRate": 0.01, "truePositiveRate": 0.16 },
    { "id": "p03", "label": "高精度寄り", "threshold": 0.84, "falsePositiveRate": 0.03, "truePositiveRate": 0.31 },
    { "id": "p04", "label": "少数レビュー", "threshold": 0.76, "falsePositiveRate": 0.07, "truePositiveRate": 0.48 },
    { "id": "p05", "label": "現行候補A", "threshold": 0.68, "falsePositiveRate": 0.12, "truePositiveRate": 0.64 },
    { "id": "p06", "label": "チーム検討案", "threshold": 0.6, "falsePositiveRate": 0.2, "truePositiveRate": 0.78 },
    { "id": "p07", "label": "感度優先", "threshold": 0.45, "falsePositiveRate": 0.34, "truePositiveRate": 0.87 },
    { "id": "p08", "label": "最も広く検知", "threshold": 0, "falsePositiveRate": 1, "truePositiveRate": 1 }
  ]
}