版の配色
1920 × 1080 作品として見る 版そのものを描画 — どの倍率でも字は潰れません 骨格・余白・カラムを重ねた状態
1920 × 1080 作品として見る 版そのものを描画 — どの倍率でも字は潰れません 骨格・余白・カラムを重ねた状態
コピーして貼るか、ファイルに保存して渡す。ネットにつながらない環境には「全部入り」を 1 つ渡せば足りる。
このパネルの中身を、URL の先にあるファイルの中身まで含めて 1 つにまとめた Markdown — 大きいのでファイルで渡す(コピーは 32KB まで)
以下の仕様でスライドを 1 枚作ってください。

- 版面 1920 × 1080
- 余白 上 100 右 140 下 100 左 140

## 文字(版面 1920px に対する px)
title  46px / 700 / 字間 0.01em
subtitle  22px / 500
axisTitle  22px / 700
tick  20px / 500
legend  20px / 500
callout  20px / 500
value  26px / 700
takeaway  28px / 500
note  20px / 400

## 配色
地 #FFFFFF / 面 #F4F6F9 / 文字 #131820 / 補助 #667183 / 強調 #1F5FA8 / 罫 #DBE1E9 / #E8C7B5 / #D78D64 / #668CB9 / #1C8C79

## 外すと崩れる点
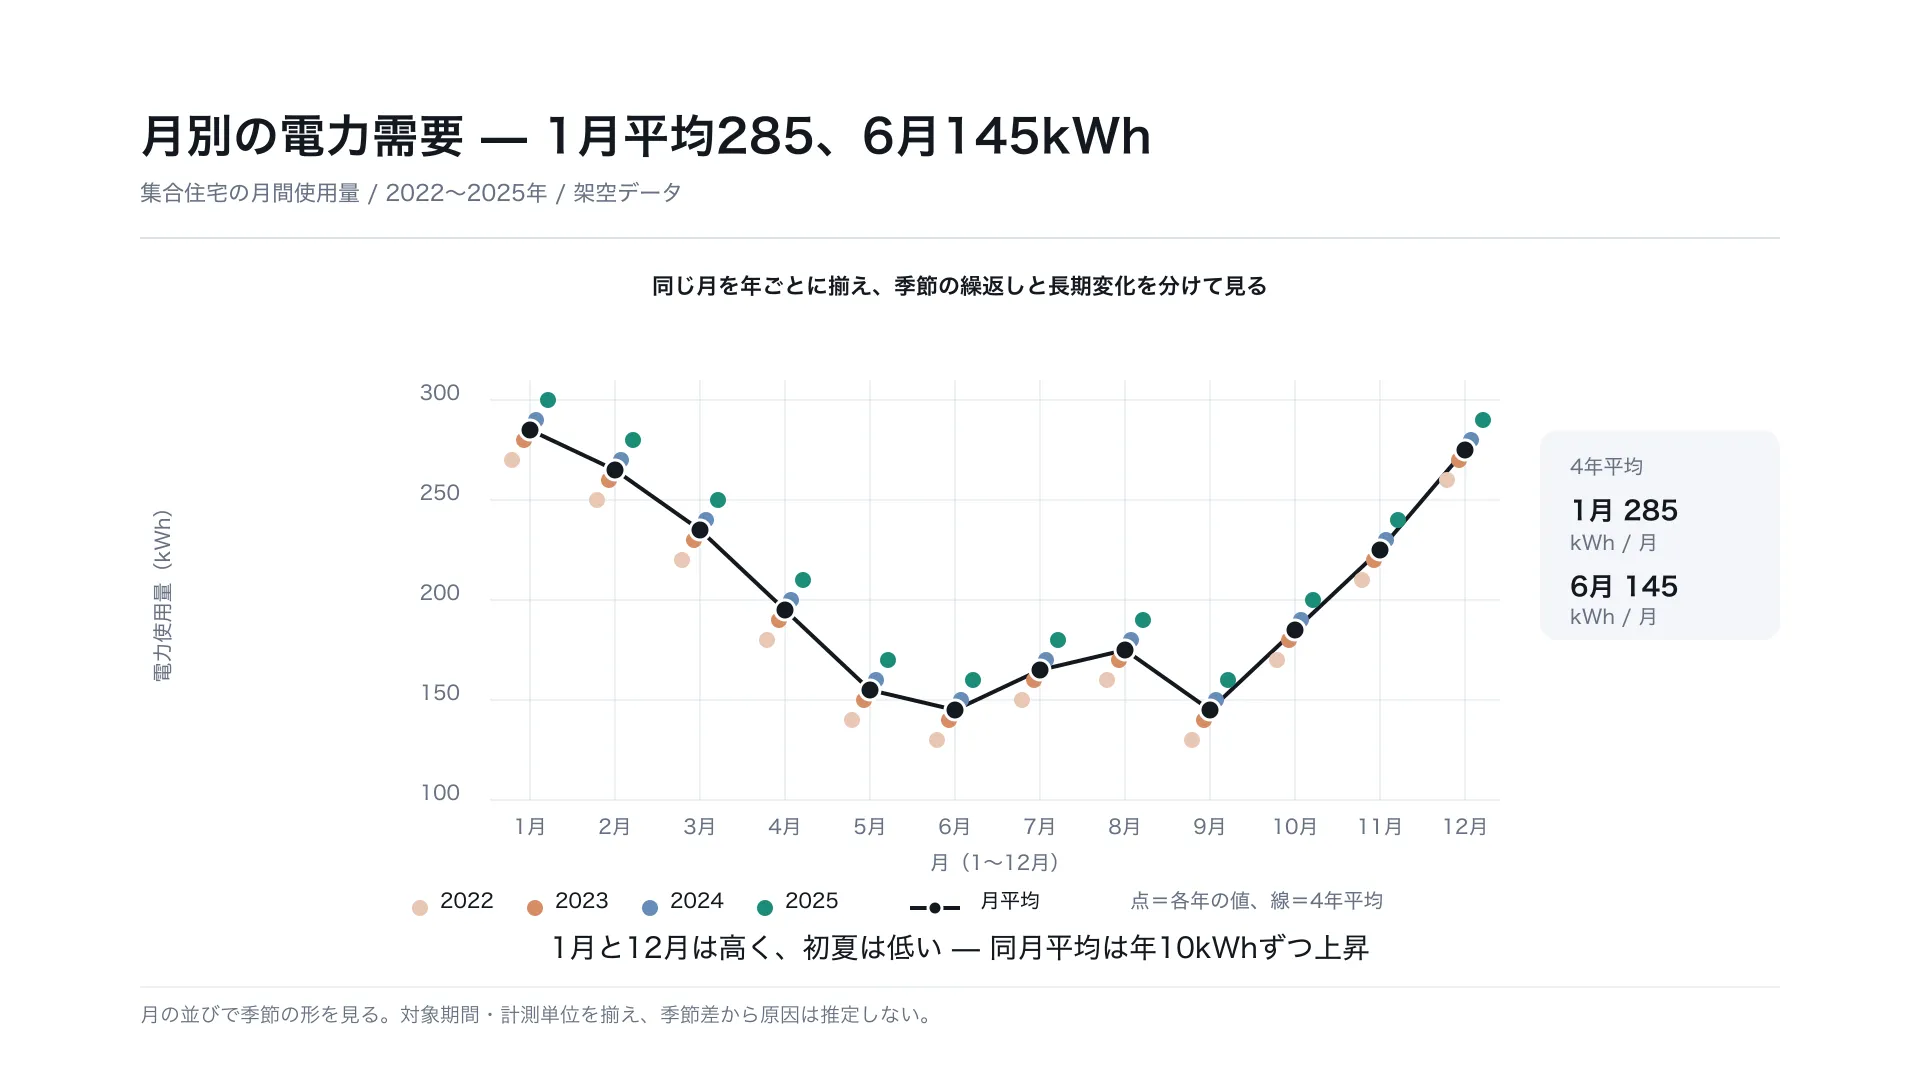
- 横方向は1月から12月の季節順に揃え、4年分の各月観測を同じ位置群に置く
- 点が年ごとの実測例、線は同月4年間の平均を結び季節の形を示す
- 月平均は2022年から2025年まで各年10kWhずつ上がるが、季節の山谷は繰り返す
- 架空データ。集計期間・計測対象・kWhの定義を揃えて比較する

内容は[ここに自分の内容を書く]に置き換えてください。寸法と配色はそのまま守ってください。
正確に再現する場合は、この HTML をそのまま使ってください: https://design-vault.pages.dev/designs/seasonal-subseries-monthly-energy-demand/pattern.html
/ai/designs/seasonal-subseries-monthly-energy-demand.json
format: slide-16x9
density: medium
layout:
  kind: axis
  canvas:
    w: 1920
    h: 1080
  margin:
    top: 100
    right: 140
    bottom: 100
    left: 140
type:
  title:
    size: 46
    weight: 700
    tracking: 0.01em
  subtitle:
    size: 22
    weight: 500
  axisTitle:
    size: 22
    weight: 700
  tick:
    size: 20
    weight: 500
  legend:
    size: 20
    weight: 500
  callout:
    size: 20
    weight: 500
  value:
    size: 26
    weight: 700
  takeaway:
    size: 28
    weight: 500
  note:
    size: 20
    weight: 400
colors:
  ground: "#FFFFFF"
  surface: "#F4F6F9"
  ink: "#131820"
  muted: "#667183"
  accent: "#1F5FA8"
  rule: "#DBE1E9"
  series:
    - "#E8C7B5"
    - "#D78D64"
    - "#668CB9"
    - "#1C8C79"
rules:
  - 横方向は1月から12月の季節順に揃え、4年分の各月観測を同じ位置群に置く
  - 点が年ごとの実測例、線は同月4年間の平均を結び季節の形を示す
  - 月平均は2022年から2025年まで各年10kWhずつ上がるが、季節の山谷は繰り返す
  - 架空データ。集計期間・計測対象・kWhの定義を揃えて比較する
{
"format": "slide-16x9",
"density": "medium",
"layout": {
"kind": "axis",
"canvas": {
"w": 1920,
"h": 1080
},
"margin": {
"top": 100,
"right": 140,
"bottom": 100,
"left": 140
}
},
"type": {
"title": {
"size": 46,
"weight": 700,
"tracking": "0.01em"
},
"subtitle": {
"size": 22,
"weight": 500
},
"axisTitle": {
"size": 22,
"weight": 700
},
"tick": {
"size": 20,
"weight": 500
},
"legend": {
"size": 20,
"weight": 500
},
"callout": {
"size": 20,
"weight": 500
},
"value": {
"size": 26,
"weight": 700
},
"takeaway": {
"size": 28,
"weight": 500
},
"note": {
"size": 20,
"weight": 400
}
},
"colors": {
"ground": "#FFFFFF",
"surface": "#F4F6F9",
"ink": "#131820",
"muted": "#667183",
"accent": "#1F5FA8",
"rule": "#DBE1E9",
"series": [
"#E8C7B5",
"#D78D64",
"#668CB9",
"#1C8C79"
]
},
"rules": [
"横方向は1月から12月の季節順に揃え、4年分の各月観測を同じ位置群に置く",
"点が年ごとの実測例、線は同月4年間の平均を結び季節の形を示す",
"月平均は2022年から2025年まで各年10kWhずつ上がるが、季節の山谷は繰り返す",
"架空データ。集計期間・計測対象・kWhの定義を揃えて比較する"
]
} /designs/seasonal-subseries-monthly-energy-demand/pattern.html — 版そのものの HTML。書体の部分集合ごと同梱で、開けばこの絵がそのまま出ます。
<!doctype html><meta charset="utf-8"><title>月別の電力需要 — 1月平均285、6月145kWh</title><meta name="dv-font" content="Zen Kaku Gothic New:400;500;700"><link rel="stylesheet" href="./font.css"><style>:root{--ground:#FFFFFF;--surface:#F4F6F9;--ink:#131820;--muted:#667183;--accent:#1F5FA8;--rule:#DBE1E9;--series-1:#E8C7B5;--series-2:#D78D64;--series-3:#668CB9;--series-4:#1C8C79;}*{box-sizing:border-box;margin:0}html,body{width:1920px;height:1080px}body{font-family:"Zen Kaku Gothic New","Hiragino Sans",sans-serif}.artboard{width:1920px;height:1080px;padding:100px 140px;background:var(--ground);color:var(--ink)}.content{width:100%;height:100%;position:relative}.figure{position:absolute;left:-140px;top:-100px;width:1920px;height:1080px}</style><div class="artboard" data-artboard><div class="content" data-content><svg class="figure" width="1920" height="1080" viewBox="0 0 1920 1080" xmlns="http://www.w3.org/2000/svg" role="img" aria-label="4年間の各月の電力使用量を月ごとに揃え、個々の年の点と月平均の線で季節性を示す。1月の4年平均は285キロワット時、6月は145キロワット時。"><style>.figure{font-family:"Zen Kaku Gothic New","Hiragino Sans",sans-serif}.ground{fill:var(--ground)}.ink{fill:var(--ink)}.muted{fill:var(--muted)}.rule{stroke:var(--rule)}.title{font-size:46px;font-weight:700;letter-spacing:.01em}.subtitle{font-size:22px;font-weight:500}.axis-title{font-size:22px;font-weight:700}.tick{font-size:20px;font-weight:500}.legend{font-size:20px;font-weight:500}.callout{font-size:20px;font-weight:500}.value{font-size:26px;font-weight:700}.takeaway{font-size:28px;font-weight:500}.note{font-size:20px;font-weight:400}.mean-line{fill:none;stroke:var(--ink);stroke-width:4}.mean-dot{fill:var(--ink);stroke:var(--ground);stroke-width:3}.year-1{fill:var(--series-1)}.year-2{fill:var(--series-2)}.year-3{fill:var(--series-3)}.year-4{fill:var(--series-4)}</style><rect class="ground" width="1920" height="1080"/><text class="ink title" data-type="title" x="140" y="153">月別の電力需要 — 1月平均285、6月145kWh</text><text class="muted subtitle" data-type="subtitle" x="140" y="201">集合住宅の月間使用量 / 2022〜2025年 / 架空データ</text><line class="rule" x1="140" y1="238" x2="1780" y2="238" stroke-width="2"/><text class="ink axis-title" data-type="axisTitle" x="960" y="294" text-anchor="middle">同じ月を年ごとに揃え、季節の繰返しと長期変化を分けて見る</text><line class="rule" x1="530" y1="380" x2="530" y2="800" stroke-width="1"/><line class="rule" x1="615" y1="380" x2="615" y2="800" stroke-width="1"/><line class="rule" x1="700" y1="380" x2="700" y2="800" stroke-width="1"/><line class="rule" x1="785" y1="380" x2="785" y2="800" stroke-width="1"/><line class="rule" x1="870" y1="380" x2="870" y2="800" stroke-width="1"/><line class="rule" x1="955" y1="380" x2="955" y2="800" stroke-width="1"/><line class="rule" x1="1040" y1="380" x2="1040" y2="800" stroke-width="1"/><line class="rule" x1="1125" y1="380" x2="1125" y2="800" stroke-width="1"/><line class="rule" x1="1210" y1="380" x2="1210" y2="800" stroke-width="1"/><line class="rule" x1="1295" y1="380" x2="1295" y2="800" stroke-width="1"/><line class="rule" x1="1380" y1="380" x2="1380" y2="800" stroke-width="1"/><line class="rule" x1="1465" y1="380" x2="1465" y2="800" stroke-width="1"/><line class="rule" x1="490" y1="800" x2="1500" y2="800" stroke-width="1"/><line class="rule" x1="490" y1="700" x2="1500" y2="700" stroke-width="1"/><line class="rule" x1="490" y1="600" x2="1500" y2="600" stroke-width="1"/><line class="rule" x1="490" y1="500" x2="1500" y2="500" stroke-width="1"/><line class="rule" x1="490" y1="400" x2="1500" y2="400" stroke-width="1"/><path class="mean-line" d="M 530 430 L 615 470 L 700 530 L 785 610 L 870 690 L 955 710 L 1040 670 L 1125 650 L 1210 710 L 1295 630 L 1380 550 L 1465 450"/><circle class="year-1" cx="512" cy="460" r="8"/><circle class="year-2" cx="524" cy="440" r="8"/><circle class="year-3" cx="536" cy="420" r="8"/><circle class="year-4" cx="548" cy="400" r="8"/><circle class="year-1" cx="597" cy="500" r="8"/><circle class="year-2" cx="609" cy="480" r="8"/><circle class="year-3" cx="621" cy="460" r="8"/><circle class="year-4" cx="633" cy="440" r="8"/><circle class="year-1" cx="682" cy="560" r="8"/><circle class="year-2" cx="694" cy="540" r="8"/><circle class="year-3" cx="706" cy="520" r="8"/><circle class="year-4" cx="718" cy="500" r="8"/><circle class="year-1" cx="767" cy="640" r="8"/><circle class="year-2" cx="779" cy="620" r="8"/><circle class="year-3" cx="791" cy="600" r="8"/><circle class="year-4" cx="803" cy="580" r="8"/><circle class="year-1" cx="852" cy="720" r="8"/><circle class="year-2" cx="864" cy="700" r="8"/><circle class="year-3" cx="876" cy="680" r="8"/><circle class="year-4" cx="888" cy="660" r="8"/><circle class="year-1" cx="937" cy="740" r="8"/><circle class="year-2" cx="949" cy="720" r="8"/><circle class="year-3" cx="961" cy="700" r="8"/><circle class="year-4" cx="973" cy="680" r="8"/><circle class="year-1" cx="1022" cy="700" r="8"/><circle class="year-2" cx="1034" cy="680" r="8"/><circle class="year-3" cx="1046" cy="660" r="8"/><circle class="year-4" cx="1058" cy="640" r="8"/><circle class="year-1" cx="1107" cy="680" r="8"/><circle class="year-2" cx="1119" cy="660" r="8"/><circle class="year-3" cx="1131" cy="640" r="8"/><circle class="year-4" cx="1143" cy="620" r="8"/><circle class="year-1" cx="1192" cy="740" r="8"/><circle class="year-2" cx="1204" cy="720" r="8"/><circle class="year-3" cx="1216" cy="700" r="8"/><circle class="year-4" cx="1228" cy="680" r="8"/><circle class="year-1" cx="1277" cy="660" r="8"/><circle class="year-2" cx="1289" cy="640" r="8"/><circle class="year-3" cx="1301" cy="620" r="8"/><circle class="year-4" cx="1313" cy="600" r="8"/><circle class="year-1" cx="1362" cy="580" r="8"/><circle class="year-2" cx="1374" cy="560" r="8"/><circle class="year-3" cx="1386" cy="540" r="8"/><circle class="year-4" cx="1398" cy="520" r="8"/><circle class="year-1" cx="1447" cy="480" r="8"/><circle class="year-2" cx="1459" cy="460" r="8"/><circle class="year-3" cx="1471" cy="440" r="8"/><circle class="year-4" cx="1483" cy="420" r="8"/><circle class="mean-dot" cx="530" cy="430" r="10"/><circle class="mean-dot" cx="615" cy="470" r="10"/><circle class="mean-dot" cx="700" cy="530" r="10"/><circle class="mean-dot" cx="785" cy="610" r="10"/><circle class="mean-dot" cx="870" cy="690" r="10"/><circle class="mean-dot" cx="955" cy="710" r="10"/><circle class="mean-dot" cx="1040" cy="670" r="10"/><circle class="mean-dot" cx="1125" cy="650" r="10"/><circle class="mean-dot" cx="1210" cy="710" r="10"/><circle class="mean-dot" cx="1295" cy="630" r="10"/><circle class="mean-dot" cx="1380" cy="550" r="10"/><circle class="mean-dot" cx="1465" cy="450" r="10"/><text class="muted tick" data-type="tick" x="460" y="800" text-anchor="end" dominant-baseline="central">100</text><text class="muted tick" data-type="tick" x="460" y="700" text-anchor="end" dominant-baseline="central">150</text><text class="muted tick" data-type="tick" x="460" y="600" text-anchor="end" dominant-baseline="central">200</text><text class="muted tick" data-type="tick" x="460" y="500" text-anchor="end" dominant-baseline="central">250</text><text class="muted tick" data-type="tick" x="460" y="400" text-anchor="end" dominant-baseline="central">300</text><text class="muted tick" data-type="tick" x="530" y="834" text-anchor="middle">1月</text><text class="muted tick" data-type="tick" x="615" y="834" text-anchor="middle">2月</text><text class="muted tick" data-type="tick" x="700" y="834" text-anchor="middle">3月</text><text class="muted tick" data-type="tick" x="785" y="834" text-anchor="middle">4月</text><text class="muted tick" data-type="tick" x="870" y="834" text-anchor="middle">5月</text><text class="muted tick" data-type="tick" x="955" y="834" text-anchor="middle">6月</text><text class="muted tick" data-type="tick" x="1040" y="834" text-anchor="middle">7月</text><text class="muted tick" data-type="tick" x="1125" y="834" text-anchor="middle">8月</text><text class="muted tick" data-type="tick" x="1210" y="834" text-anchor="middle">9月</text><text class="muted tick" data-type="tick" x="1295" y="834" text-anchor="middle">10月</text><text class="muted tick" data-type="tick" x="1380" y="834" text-anchor="middle">11月</text><text class="muted tick" data-type="tick" x="1465" y="834" text-anchor="middle">12月</text><text class="muted tick" x="1000" y="870" text-anchor="middle">月(1〜12月)</text><text class="muted tick" x="170" y="590" text-anchor="middle" transform="rotate(-90 170 590)">電力使用量(kWh)</text><rect x="1540" y="430" width="240" height="210" rx="18" fill="var(--surface)"/><text class="muted callout" x="1570" y="474">4年平均</text><text class="ink value" x="1570" y="520">1月 285</text><text class="muted callout" x="1570" y="550">kWh / 月</text><text class="ink value" x="1570" y="596">6月 145</text><text class="muted callout" x="1570" y="624">kWh / 月</text><g class="legend" dominant-baseline="central"><circle cx="420" cy="908" r="8" fill="var(--series-1)"/><text class="ink" data-type="legend" x="440" y="908">2022</text><circle cx="535" cy="908" r="8" fill="var(--series-2)"/><text class="ink" x="555" y="908">2023</text><circle cx="650" cy="908" r="8" fill="var(--series-3)"/><text class="ink" x="670" y="908">2024</text><circle cx="765" cy="908" r="8" fill="var(--series-4)"/><text class="ink" x="785" y="908">2025</text><line class="mean-line" x1="910" y1="908" x2="960" y2="908"/><circle class="mean-dot" cx="935" cy="908" r="7"/><text class="ink" x="980" y="908">月平均</text><text class="muted" x="1130" y="908">点=各年の値、線=4年平均</text></g><text class="ink takeaway" data-type="takeaway" x="960" y="958" text-anchor="middle">1月と12月は高く、初夏は低い — 同月平均は年10kWhずつ上昇</text><line class="rule" x1="140" y1="987" x2="1780" y2="987" stroke-width="1"/><text class="muted note" data-type="note" x="140" y="1022">月の並びで季節の形を見る。対象期間・計測単位を揃え、季節差から原因は推定しない。</text></svg></div></div> /designs/seasonal-subseries-monthly-energy-demand/font.css — 全部入りには入れていない
/* dv-subset v2 — generated by scripts/subset-font.mjs. Do not edit.
 * font    Zen Kaku Gothic New 400;500;700
 * chars   100 (9994e7bce094963a)
 *
 * pattern.html の文字だけを含む部分集合。描画時に外部へ取りに行かないよう同梱する。
 * 版の文字を変えたら取り直すこと — 忘れると足りない字が豆腐になる。
 * その取り忘れは pattern-entries.test.ts が上の指紋で検出する。
 */

@font-face {
  font-family: 'Zen Kaku Gothic New';
  font-style: normal;
  font-weight: 400;
  font-display: block;
  src: url(./font-0.woff2) format('woff2');
  unicode-range: U+2f-39, U+57, U+68, U+6b, U+2014, U+3001-3002, U+301c, U+3044, U+3048, U+304b-304c, U+304f-3054, U+3057-305a, U+3064-306b, U+306e-3070, U+3072-3073, U+3089, U+308b, U+3092, U+3099, U+30bf-30c0, U+30c6-30c7, U+30fb-30fc, U+4e0a, U+4e26, U+4f4d-4f4f, U+4f7f, U+5024, U+5206, U+521d, U+5225, U+529b, U+5316, U+5358, U+539f, U+5404, U+5408, U+540c, U+56e0, U+5747, U+5909, U+590f, U+5b63, U+5b85, U+5b9a, U+5bfe, U+5dee, U+5e73-5e74, U+5f62, U+63a8, U+63c3, U+6607, U+6708, U+671f, U+67b6, U+6e2c, U+70b9, U+7528, U+7a7a, U+7bc0, U+7dda, U+7e70, U+8981, U+898b, U+8a08, U+8c61, U+8fd4, U+91cf, U+9577, U+9593, U+96c6, U+96fb, U+9700, U+9ad8, U+ff08-ff09, U+ff1d;
}
@font-face {
  font-family: 'Zen Kaku Gothic New';
  font-style: normal;
  font-weight: 500;
  font-display: block;
  src: url(./font-1.woff2) format('woff2');
  unicode-range: U+2f-39, U+57, U+68, U+6b, U+2014, U+3001-3002, U+301c, U+3044, U+3048, U+304b-304c, U+304f-3054, U+3057-305a, U+3064-306b, U+306e-3070, U+3072-3073, U+3089, U+308b, U+3092, U+3099, U+30bf-30c0, U+30c6-30c7, U+30fb-30fc, U+4e0a, U+4e26, U+4f4d-4f4f, U+4f7f, U+5024, U+5206, U+521d, U+5225, U+529b, U+5316, U+5358, U+539f, U+5404, U+5408, U+540c, U+56e0, U+5747, U+5909, U+590f, U+5b63, U+5b85, U+5b9a, U+5bfe, U+5dee, U+5e73-5e74, U+5f62, U+63a8, U+63c3, U+6607, U+6708, U+671f, U+67b6, U+6e2c, U+70b9, U+7528, U+7a7a, U+7bc0, U+7dda, U+7e70, U+8981, U+898b, U+8a08, U+8c61, U+8fd4, U+91cf, U+9577, U+9593, U+96c6, U+96fb, U+9700, U+9ad8, U+ff08-ff09, U+ff1d;
}
@font-face {
  font-family: 'Zen Kaku Gothic New';
  font-style: normal;
  font-weight: 700;
  font-display: block;
  src: url(./font-2.woff2) format('woff2');
  unicode-range: U+2f-39, U+57, U+68, U+6b, U+2014, U+3001-3002, U+301c, U+3044, U+3048, U+304b-304c, U+304f-3054, U+3057-305a, U+3064-306b, U+306e-3070, U+3072-3073, U+3089, U+308b, U+3092, U+3099, U+30bf-30c0, U+30c6-30c7, U+30fb-30fc, U+4e0a, U+4e26, U+4f4d-4f4f, U+4f7f, U+5024, U+5206, U+521d, U+5225, U+529b, U+5316, U+5358, U+539f, U+5404, U+5408, U+540c, U+56e0, U+5747, U+5909, U+590f, U+5b63, U+5b85, U+5b9a, U+5bfe, U+5dee, U+5e73-5e74, U+5f62, U+63a8, U+63c3, U+6607, U+6708, U+671f, U+67b6, U+6e2c, U+70b9, U+7528, U+7a7a, U+7bc0, U+7dda, U+7e70, U+8981, U+898b, U+8a08, U+8c61, U+8fd4, U+91cf, U+9577, U+9593, U+96c6, U+96fb, U+9700, U+9ad8, U+ff08-ff09, U+ff1d;
}
電力使用量の月ごとの季節パターンは毎年繰り返されるか。また、同じ月の使用量は年々変わっているか。
横軸を1月から12月の季節順、縦軸を月間電力使用量にする。各月の位置には4年分の値を点で並べ、同じ月の4年間平均を太線で結ぶ。点群の縦幅は年ごとのばらつき、平均線の山谷は季節性、線の高さの年次差は同月値の変化を示す。
架空例では1月平均が285kWh、6月平均が145kWhで、月平均は2022〜2025年に毎年10kWhずつ増えている。通常の折れ線グラフが時間順の連続推移を示すのに対し、このseasonal subseries plotは暦月で年を揃え、季節の繰返しと同月比較を直接読む。カレンダーヒートマップのように日付ごとの活動量を示す図ではない。実測値や原因についての主張ではない。