版の配色
1920 × 1080 作品として見る 版そのものを描画 — どの倍率でも字は潰れません 骨格・余白・カラムを重ねた状態
1920 × 1080 作品として見る 版そのものを描画 — どの倍率でも字は潰れません 骨格・余白・カラムを重ねた状態
コピーして貼るか、ファイルに保存して渡す。ネットにつながらない環境には「全部入り」を 1 つ渡せば足りる。
このパネルの中身を、URL の先にあるファイルの中身まで含めて 1 つにまとめた Markdown — 大きいのでファイルで渡す(コピーは 32KB まで)
以下の仕様でスライドを 1 枚作ってください。

- 版面 1920 × 1080
- 余白 上 100 右 140 下 100 左 140

## 文字(版面 1920px に対する px)
title  46px / 700 / 字間 0.01em
subtitle  22px / 500
axisTitle  22px / 700
tick  20px / 500
period  20px / 700
calloutLabel  20px / 500
calloutValue  26px / 700
takeaway  28px / 500
note  20px / 400

## 配色
地 #FFFFFF / 面 #F4F6F9 / 文字 #131820 / 補助 #667183 / 強調 #1F5FA8 / 罫 #DBE1E9 / #1C8C79 / #A85A2E / #8D99A8

## 外すと崩れる点
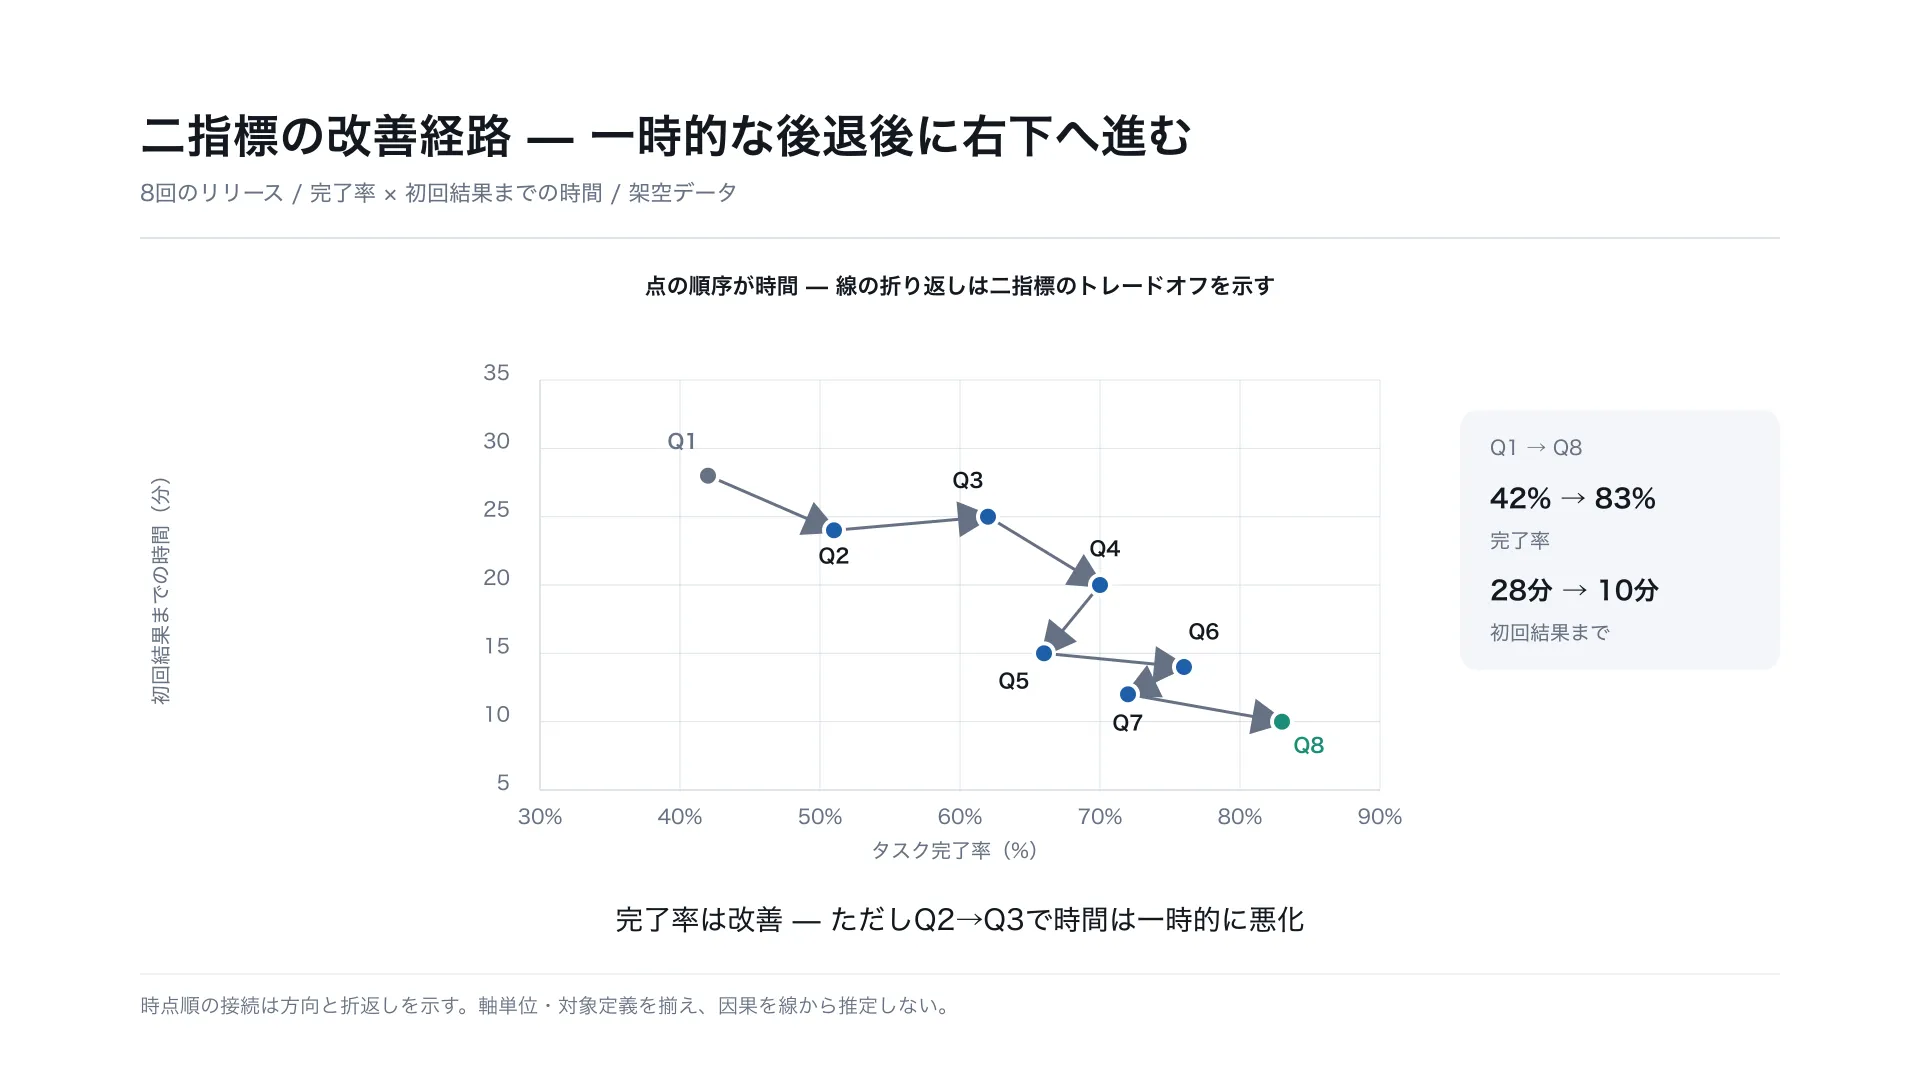
- 2軸は異なる測定値、点と矢印の順番は8回のリリース時点を示す
- 横軸はタスク完了率、縦軸は初回結果までの時間。右下ほど両指標が改善する
- Q2→Q3のような折り返しは一方の指標が後退した時点を示す
- 架空データ。各時点で対象母集団・定義を揃え、接続線から因果を推定しない

内容は[ここに自分の内容を書く]に置き換えてください。寸法と配色はそのまま守ってください。
正確に再現する場合は、この HTML をそのまま使ってください: https://design-vault.pages.dev/designs/connected-scatterplot-release-tradeoffs/pattern.html
/ai/designs/connected-scatterplot-release-tradeoffs.json
format: slide-16x9
density: medium
layout:
  kind: axis
  canvas:
    w: 1920
    h: 1080
  margin:
    top: 100
    right: 140
    bottom: 100
    left: 140
type:
  title:
    size: 46
    weight: 700
    tracking: 0.01em
  subtitle:
    size: 22
    weight: 500
  axisTitle:
    size: 22
    weight: 700
  tick:
    size: 20
    weight: 500
  period:
    size: 20
    weight: 700
  calloutLabel:
    size: 20
    weight: 500
  calloutValue:
    size: 26
    weight: 700
  takeaway:
    size: 28
    weight: 500
  note:
    size: 20
    weight: 400
colors:
  ground: "#FFFFFF"
  surface: "#F4F6F9"
  ink: "#131820"
  muted: "#667183"
  accent: "#1F5FA8"
  rule: "#DBE1E9"
  series:
    - "#1C8C79"
    - "#A85A2E"
    - "#8D99A8"
rules:
  - 2軸は異なる測定値、点と矢印の順番は8回のリリース時点を示す
  - 横軸はタスク完了率、縦軸は初回結果までの時間。右下ほど両指標が改善する
  - Q2→Q3のような折り返しは一方の指標が後退した時点を示す
  - 架空データ。各時点で対象母集団・定義を揃え、接続線から因果を推定しない
{
"format": "slide-16x9",
"density": "medium",
"layout": {
"kind": "axis",
"canvas": {
"w": 1920,
"h": 1080
},
"margin": {
"top": 100,
"right": 140,
"bottom": 100,
"left": 140
}
},
"type": {
"title": {
"size": 46,
"weight": 700,
"tracking": "0.01em"
},
"subtitle": {
"size": 22,
"weight": 500
},
"axisTitle": {
"size": 22,
"weight": 700
},
"tick": {
"size": 20,
"weight": 500
},
"period": {
"size": 20,
"weight": 700
},
"calloutLabel": {
"size": 20,
"weight": 500
},
"calloutValue": {
"size": 26,
"weight": 700
},
"takeaway": {
"size": 28,
"weight": 500
},
"note": {
"size": 20,
"weight": 400
}
},
"colors": {
"ground": "#FFFFFF",
"surface": "#F4F6F9",
"ink": "#131820",
"muted": "#667183",
"accent": "#1F5FA8",
"rule": "#DBE1E9",
"series": [
"#1C8C79",
"#A85A2E",
"#8D99A8"
]
},
"rules": [
"2軸は異なる測定値、点と矢印の順番は8回のリリース時点を示す",
"横軸はタスク完了率、縦軸は初回結果までの時間。右下ほど両指標が改善する",
"Q2→Q3のような折り返しは一方の指標が後退した時点を示す",
"架空データ。各時点で対象母集団・定義を揃え、接続線から因果を推定しない"
]
} /designs/connected-scatterplot-release-tradeoffs/pattern.html — 版そのものの HTML。書体の部分集合ごと同梱で、開けばこの絵がそのまま出ます。
<!doctype html><meta charset="utf-8"><title>二指標の改善経路 — 一時的な後退後に右下へ進む</title><meta name="dv-font" content="Zen Kaku Gothic New:400;500;700"><link rel="stylesheet" href="./font.css"><style>:root{--ground:#FFFFFF;--surface:#F4F6F9;--ink:#131820;--muted:#667183;--accent:#1F5FA8;--rule:#DBE1E9;--series-1:#1C8C79;--series-2:#A85A2E;--series-3:#8D99A8;}*{box-sizing:border-box;margin:0}html,body{width:1920px;height:1080px}body{font-family:"Zen Kaku Gothic New","Hiragino Sans",sans-serif}.artboard{width:1920px;height:1080px;padding:100px 140px;background:var(--ground);color:var(--ink)}.content{width:100%;height:100%;position:relative}.figure{position:absolute;left:-140px;top:-100px;width:1920px;height:1080px}</style><div class="artboard" data-artboard><div class="content" data-content><svg class="figure" width="1920" height="1080" viewBox="0 0 1920 1080" xmlns="http://www.w3.org/2000/svg" role="img" aria-label="8回のリリースで完了率と初回結果までの時間がどう変わったかを二指標平面上の接続点で表示。矢印は時系列順を示し、Q2からQ3で時間が一時悪化した。"><defs><marker id="arrow" markerWidth="12" markerHeight="12" refX="10" refY="6" orient="auto" markerUnits="strokeWidth"><path d="M 0 0 L 12 6 L 0 12 Z" fill="var(--muted)"/></marker></defs><style>.figure{font-family:"Zen Kaku Gothic New","Hiragino Sans",sans-serif}.ground{fill:var(--ground)}.ink{fill:var(--ink)}.muted{fill:var(--muted)}.rule{stroke:var(--rule)}.title{font-size:46px;font-weight:700;letter-spacing:.01em}.subtitle{font-size:22px;font-weight:500}.axis-title{font-size:22px;font-weight:700}.tick{font-size:20px;font-weight:500}.period{font-size:20px;font-weight:700}.takeaway{font-size:28px;font-weight:500}.note{font-size:20px;font-weight:400}.callout-label{font-size:20px;font-weight:500}.callout-value{font-size:26px;font-weight:700}.trajectory{stroke:var(--muted);stroke-width:3;fill:none}.point{stroke:var(--ground);stroke-width:4}.point.start{fill:var(--muted)}.point.middle{fill:var(--accent)}.point.end{fill:var(--series-1)}.period.start{fill:var(--muted)}.period.middle{fill:var(--ink)}.period.end{fill:var(--series-1)}</style><rect class="ground" width="1920" height="1080"/><text class="ink title" data-type="title" x="140" y="153">二指標の改善経路 — 一時的な後退後に右下へ進む</text><text class="muted subtitle" data-type="subtitle" x="140" y="201">8回のリリース / 完了率 × 初回結果までの時間 / 架空データ</text><line class="rule" x1="140" y1="238" x2="1780" y2="238" stroke-width="2"/><text class="ink axis-title" data-type="axisTitle" x="960" y="294" text-anchor="middle">点の順序が時間 — 線の折り返しは二指標のトレードオフを示す</text><line class="rule" x1="540" y1="380" x2="540" y2="790" stroke-width="1"/><line class="rule" x1="680" y1="380" x2="680" y2="790" stroke-width="1"/><line class="rule" x1="820" y1="380" x2="820" y2="790" stroke-width="1"/><line class="rule" x1="960" y1="380" x2="960" y2="790" stroke-width="1"/><line class="rule" x1="1100" y1="380" x2="1100" y2="790" stroke-width="1"/><line class="rule" x1="1240" y1="380" x2="1240" y2="790" stroke-width="1"/><line class="rule" x1="1380" y1="380" x2="1380" y2="790" stroke-width="1"/><line class="rule" x1="540" y1="790" x2="1380" y2="790" stroke-width="1"/><line class="rule" x1="540" y1="721.6666666666666" x2="1380" y2="721.6666666666666" stroke-width="1"/><line class="rule" x1="540" y1="653.3333333333334" x2="1380" y2="653.3333333333334" stroke-width="1"/><line class="rule" x1="540" y1="585" x2="1380" y2="585" stroke-width="1"/><line class="rule" x1="540" y1="516.6666666666667" x2="1380" y2="516.6666666666667" stroke-width="1"/><line class="rule" x1="540" y1="448.3333333333333" x2="1380" y2="448.3333333333333" stroke-width="1"/><line class="rule" x1="540" y1="380" x2="1380" y2="380" stroke-width="1"/><line class="rule" x1="540" y1="790" x2="1380" y2="790" stroke-width="1.5"/><line class="rule" x1="540" y1="380" x2="540" y2="790" stroke-width="1.5"/><line class="trajectory" x1="708.0" y1="475.7" x2="834.0" y2="530.3" marker-end="url(#arrow)"/><line class="trajectory" x1="834.0" y1="530.3" x2="988.0" y2="516.7" marker-end="url(#arrow)"/><line class="trajectory" x1="988.0" y1="516.7" x2="1100.0" y2="585.0" marker-end="url(#arrow)"/><line class="trajectory" x1="1100.0" y1="585.0" x2="1044.0" y2="653.3" marker-end="url(#arrow)"/><line class="trajectory" x1="1044.0" y1="653.3" x2="1184.0" y2="667.0" marker-end="url(#arrow)"/><line class="trajectory" x1="1184.0" y1="667.0" x2="1128.0" y2="694.3" marker-end="url(#arrow)"/><line class="trajectory" x1="1128.0" y1="694.3" x2="1282.0" y2="721.7" marker-end="url(#arrow)"/><circle class="point start" cx="708.0" cy="475.7" r="10"/><circle class="point middle" cx="834.0" cy="530.3" r="10"/><circle class="point middle" cx="988.0" cy="516.7" r="10"/><circle class="point middle" cx="1100.0" cy="585.0" r="10"/><circle class="point middle" cx="1044.0" cy="653.3" r="10"/><circle class="point middle" cx="1184.0" cy="667.0" r="10"/><circle class="point middle" cx="1128.0" cy="694.3" r="10"/><circle class="point end" cx="1282.0" cy="721.7" r="10"/><text class="ink period start" data-type="period" x="683.0" y="448.7" text-anchor="middle" dominant-baseline="central">Q1</text><text class="ink period middle" data-type="period" x="834.0" y="563.3" text-anchor="middle" dominant-baseline="central">Q2</text><text class="ink period middle" data-type="period" x="968.0" y="487.7" text-anchor="middle" dominant-baseline="central">Q3</text><text class="ink period middle" data-type="period" x="1105.0" y="556.0" text-anchor="middle" dominant-baseline="central">Q4</text><text class="ink period middle" data-type="period" x="1014.0" y="688.3" text-anchor="middle" dominant-baseline="central">Q5</text><text class="ink period middle" data-type="period" x="1204.0" y="639.0" text-anchor="middle" dominant-baseline="central">Q6</text><text class="ink period middle" data-type="period" x="1128.0" y="730.3" text-anchor="middle" dominant-baseline="central">Q7</text><text class="ink period end" data-type="period" x="1309.0" y="752.7" text-anchor="middle" dominant-baseline="central">Q8</text><text class="muted tick" data-type="tick" x="540" y="824" text-anchor="middle">30%</text><text class="muted tick" data-type="tick" x="680" y="824" text-anchor="middle">40%</text><text class="muted tick" data-type="tick" x="820" y="824" text-anchor="middle">50%</text><text class="muted tick" data-type="tick" x="960" y="824" text-anchor="middle">60%</text><text class="muted tick" data-type="tick" x="1100" y="824" text-anchor="middle">70%</text><text class="muted tick" data-type="tick" x="1240" y="824" text-anchor="middle">80%</text><text class="muted tick" data-type="tick" x="1380" y="824" text-anchor="middle">90%</text><text class="muted tick" x="510" y="790" text-anchor="end" dominant-baseline="central">5</text><text class="muted tick" x="510" y="721.6666666666666" text-anchor="end" dominant-baseline="central">10</text><text class="muted tick" x="510" y="653.3333333333334" text-anchor="end" dominant-baseline="central">15</text><text class="muted tick" x="510" y="585" text-anchor="end" dominant-baseline="central">20</text><text class="muted tick" x="510" y="516.6666666666667" text-anchor="end" dominant-baseline="central">25</text><text class="muted tick" x="510" y="448.3333333333333" text-anchor="end" dominant-baseline="central">30</text><text class="muted tick" x="510" y="380" text-anchor="end" dominant-baseline="central">35</text><text class="muted tick" x="960" y="858" text-anchor="middle">タスク完了率(%)</text><text class="muted tick" x="168" y="585" text-anchor="middle" transform="rotate(-90 168 585)">初回結果までの時間(分)</text><rect x="1460" y="410" width="320" height="260" rx="18" fill="var(--surface)"/><text class="muted callout-label" x="1490" y="455">Q1 → Q8</text><text class="ink callout-value" x="1490" y="508">42% → 83%</text><text class="muted callout-label" x="1490" y="548">完了率</text><text class="ink callout-value" x="1490" y="600">28分 → 10分</text><text class="muted callout-label" x="1490" y="640">初回結果まで</text><text class="ink takeaway" data-type="takeaway" x="960" y="930" text-anchor="middle">完了率は改善 — ただしQ2→Q3で時間は一時的に悪化</text><line class="rule" x1="140" y1="974" x2="1780" y2="974" stroke-width="1"/><text class="muted note" data-type="note" x="140" y="1013">時点順の接続は方向と折返しを示す。軸単位・対象定義を揃え、因果を線から推定しない。</text></svg></div></div> /designs/connected-scatterplot-release-tradeoffs/font.css — 全部入りには入れていない
/* dv-subset v2 — generated by scripts/subset-font.mjs. Do not edit.
 * font    Zen Kaku Gothic New 400;500;700
 * chars   101 (0ba283c96be46341)
 *
 * pattern.html の文字だけを含む部分集合。描画時に外部へ取りに行かないよう同梱する。
 * 版の文字を変えたら取り直すこと — 忘れると足りない字が豆腐になる。
 * その取り忘れは pattern-entries.test.ts が上の指紋で検出する。
 */

@font-face {
  font-family: 'Zen Kaku Gothic New';
  font-style: normal;
  font-weight: 400;
  font-display: block;
  src: url(./font-0.woff2) format('woff2');
  unicode-range: U+25, U+2f-39, U+51, U+d7, U+2014, U+2192, U+3001-3002, U+3044, U+3048, U+304b-304c, U+3057-305a, U+305f-3060, U+3066-306b, U+306e-3070, U+3078-3079, U+307e, U+3080, U+3089-308a, U+3092, U+3099, U+30aa, U+30af-30b0, U+30b9-30ba, U+30bf-30c0, U+30c6-30c9, U+30d5-30d6, U+30ea, U+30ec, U+30fb-30fc, U+4e00, U+4e0b, U+4e86, U+4e8c, U+4f4d, U+5206, U+521d, U+5316, U+5358, U+53f3, U+5411, U+5584, U+56de, U+56e0, U+5b8c, U+5b9a, U+5bfe, U+5e8f, U+5f8c, U+60aa, U+6298, U+6307, U+63a5, U+63a8, U+63c3, U+6539, U+65b9, U+6642, U+679c, U+67b6, U+6a19, U+70b9, U+7387, U+7684, U+793a, U+7a7a, U+7d4c, U+7d50, U+7d9a, U+7dda, U+7fa9, U+8c61, U+8def, U+8ef8, U+8fd4, U+9000, U+9032, U+9593, U+9806, U+ff08-ff09;
}
@font-face {
  font-family: 'Zen Kaku Gothic New';
  font-style: normal;
  font-weight: 500;
  font-display: block;
  src: url(./font-1.woff2) format('woff2');
  unicode-range: U+25, U+2f-39, U+51, U+d7, U+2014, U+2192, U+3001-3002, U+3044, U+3048, U+304b-304c, U+3057-305a, U+305f-3060, U+3066-306b, U+306e-3070, U+3078-3079, U+307e, U+3080, U+3089-308a, U+3092, U+3099, U+30aa, U+30af-30b0, U+30b9-30ba, U+30bf-30c0, U+30c6-30c9, U+30d5-30d6, U+30ea, U+30ec, U+30fb-30fc, U+4e00, U+4e0b, U+4e86, U+4e8c, U+4f4d, U+5206, U+521d, U+5316, U+5358, U+53f3, U+5411, U+5584, U+56de, U+56e0, U+5b8c, U+5b9a, U+5bfe, U+5e8f, U+5f8c, U+60aa, U+6298, U+6307, U+63a5, U+63a8, U+63c3, U+6539, U+65b9, U+6642, U+679c, U+67b6, U+6a19, U+70b9, U+7387, U+7684, U+793a, U+7a7a, U+7d4c, U+7d50, U+7d9a, U+7dda, U+7fa9, U+8c61, U+8def, U+8ef8, U+8fd4, U+9000, U+9032, U+9593, U+9806, U+ff08-ff09;
}
@font-face {
  font-family: 'Zen Kaku Gothic New';
  font-style: normal;
  font-weight: 700;
  font-display: block;
  src: url(./font-2.woff2) format('woff2');
  unicode-range: U+25, U+2f-39, U+51, U+d7, U+2014, U+2192, U+3001-3002, U+3044, U+3048, U+304b-304c, U+3057-305a, U+305f-3060, U+3066-306b, U+306e-3070, U+3078-3079, U+307e, U+3080, U+3089-308a, U+3092, U+3099, U+30aa, U+30af-30b0, U+30b9-30ba, U+30bf-30c0, U+30c6-30c9, U+30d5-30d6, U+30ea, U+30ec, U+30fb-30fc, U+4e00, U+4e0b, U+4e86, U+4e8c, U+4f4d, U+5206, U+521d, U+5316, U+5358, U+53f3, U+5411, U+5584, U+56de, U+56e0, U+5b8c, U+5b9a, U+5bfe, U+5e8f, U+5f8c, U+60aa, U+6298, U+6307, U+63a5, U+63a8, U+63c3, U+6539, U+65b9, U+6642, U+679c, U+67b6, U+6a19, U+70b9, U+7387, U+7684, U+793a, U+7a7a, U+7d4c, U+7d50, U+7d9a, U+7dda, U+7fa9, U+8c61, U+8def, U+8ef8, U+8fd4, U+9000, U+9032, U+9593, U+9806, U+ff08-ff09;
}
リリースを重ねる間に、完了率と初回結果までの時間はどう動き、どこで一時的に後退したか。
横軸と縦軸に別々の指標を置き、8時点の点を時系列順に矢印で結ぶ。各点の座標は2つの測定値、点の接続順は時間を示すため、2軸上の経路の曲がりからトレードオフや後戻りを読める。
Q1からQ8にかけて完了率は42%から83%へ上がり、初回結果までの時間は28分から10分へ短くなった。一方Q2→Q3では完了率が上がる間に時間が24分から25分へ悪化している。一般の散布図は時系列の接続順を持たず、line-trendは時間を横軸とする単変量の推移、slope-changeは2時点の複数対象比較であるため、connected scatterplotは二指標の平面を進む経路を問う。架空例で、因果関係は示さない。