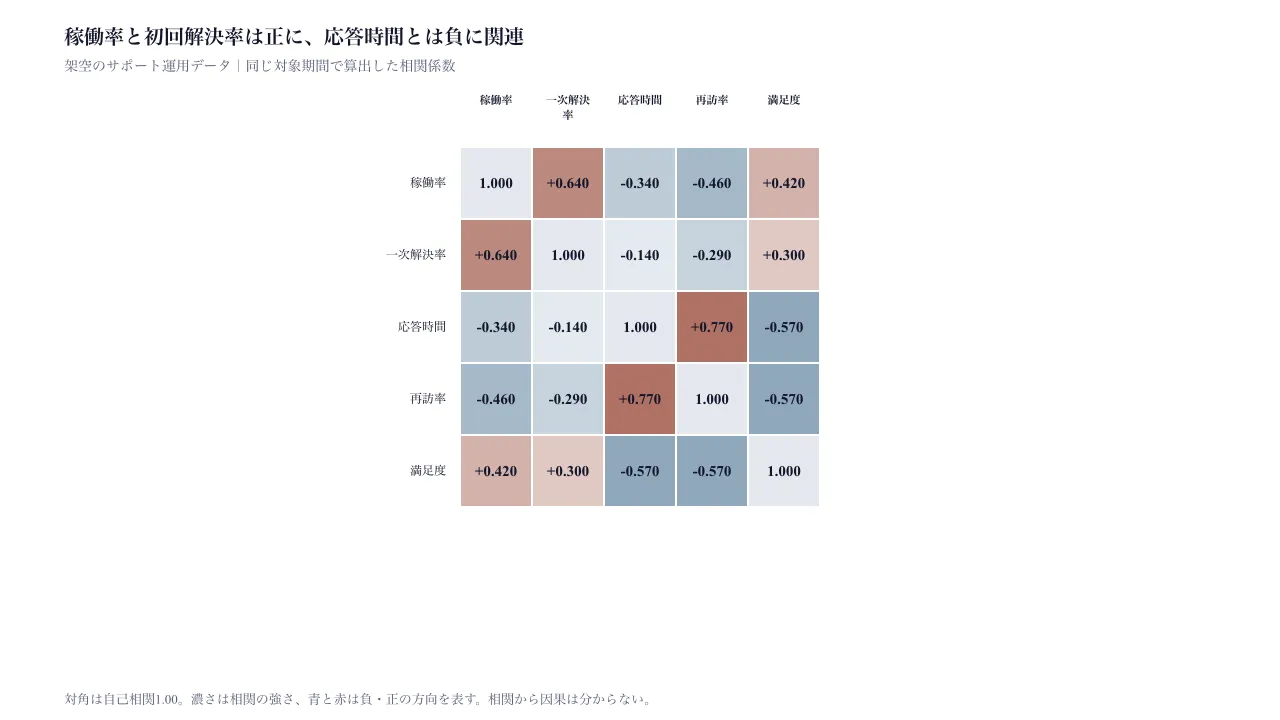
作品として見る 生成された文書そのもの — 切り替えも開閉もそのまま動きます
作品として見る 生成された文書そのもの — 切り替えも開閉もそのまま動きます
コピーして貼るか、ファイルに保存して渡す。ネットにつながらない環境には「全部入り」を 1 つ渡せば足りる。
このパネルの中身を、URL の先にあるファイルの中身まで含めて 1 つにまとめた Markdown — 大きいのでファイルで渡す(コピーは 32KB まで)
「相関行列」でHTML資料を作ってください。この型は実行できるので、版面を組み直す必要はありません — 必要なのは中身です。

## この型がすること
複数指標の相関係数を対称行列で示し、正負の関係と強さを比較する。

## 渡す必要があるもの
- 指標名と異なる指標の組み合わせごとに相関係数を一度ずつ指定する。対角1と対称側は自動で補う。
- 相関係数は-1〜+1、小数第3位まで。測定条件と対象期間を揃え、架空例以外では出典を明記する。

## 入力の形
- `title` — string — 相関の傾向を要約する見出し
- `subtitle` — string? — 対象・測定条件・時点
- `variables` — array — 指標名、3〜8件
- `pairs` — array (row, column, coefficient) — 異なる指標の全ペア。係数は-1〜+1、小数第3位まで

入力の機械可読な検証は schema.ts が持ちます。足りない入力は推測せず質問してください。

## 向かない場合
- 相関を因果関係や施策効果として解釈する場合。
- 個別の観測値や時系列順序を比較する場合。

## 作り方
入力を JSON にまとめ、次を実行します。

```bash
node scripts/render.mjs correlation-matrix <入力.json> --theme ink -o out.html
```

出力は 1 ファイルで完結し、外部から何も読み込みません。

## 原本
- https://design-vault.pages.dev/designs/correlation-matrix/source/template.tsx
- https://design-vault.pages.dev/designs/correlation-matrix/source/schema.ts
- https://design-vault.pages.dev/designs/correlation-matrix/source/sample-data.json
- https://design-vault.pages.dev/designs/correlation-matrix/sample.html
テンプレート・入力スキーマ・サンプルデータ・メタ情報。この文書はこの 4 つから生成されています。 生成された文書
/designs/correlation-matrix/source/template.tsx
import type { Props } from "./schema";

const joinIds = (...parts: (string | number)[]) =>
  parts.map((part) => String(part).replace(/[_-]/g, (c) => `_${c.charCodeAt(0).toString(16)}_`)).join("-");

const fmt = (n: number) => `${n > 0 ? "+" : ""}${n.toFixed(3)}`;
const wrap = (text: string, width: number) => Array.from({ length: Math.ceil([...text].length / width) }, (_, i) => [...text].slice(i * width, (i + 1) * width).join(""));
function color(value: number) {
  const target = value < 0 ? [36, 85, 122] : [139, 52, 33];
  const t = Math.abs(value) * 0.9;
  const rgb = target.map(channel => Math.round(255 + (channel - 255) * t));
  return `#${rgb.map(channel => channel.toString(16).padStart(2, "0")).join("")}`;
}

export default function Template(d: Props) {
  const titleLines = wrap(d.title, 48);
  const subtitleLines = d.subtitle ? wrap(d.subtitle, 80) : [];
  const titleY = 44;
  const subtitleY = titleY + titleLines.length * 23 + 4;
  const gridY = subtitleY + subtitleLines.length * 18 + 58;
  const cell = Math.min(72, 432 / d.variables.length);
  const size = cell * d.variables.length;
  const gridX = (1280 - size) / 2;
  const labelX = gridX - 14;
  const coefficientByPair = new Map(d.pairs.map(pair => {
    const i = d.variables.indexOf(pair.row);
    const j = d.variables.indexOf(pair.column);
    return [`${i}:${j}`, pair.coefficient];
  }));
  const matrixValue = (row: number, column: number) => {
    if (row === column) return 1;
    const i = Math.min(row, column);
    const j = Math.max(row, column);
    return coefficientByPair.get(`${i}:${j}`)!;
  };
  const columnLabels = d.variables.map(name => wrap(name, 4));
  const variablePairs = d.pairs.map(pair => ({ ...pair, sign: pair.coefficient > 0 ? "positive" : pair.coefficient < 0 ? "negative" : "neutral" }));

  return <section className="asset correlation">
    <style>{`.correlation{font-family:var(--font-sans);color:var(--color-on-surface);background:var(--color-surface);max-width:var(--container-slide);margin:auto;padding:2rem;line-height:1.5;font-size:var(--text-body-sm)}.correlation *{box-sizing:border-box}.correlation h1{font-size:var(--text-h2);line-height:1.3;margin:0}.muted{color:var(--color-secondary)}.plot{display:block;width:100%;height:auto}.plot .svg-title,.plot .svg-subtitle{display:none}.pair-list{display:grid;grid-template-columns:repeat(4,minmax(0,1fr));gap:.25rem;margin-top:1rem}.pair{min-width:0;overflow-wrap:anywhere;padding:.75rem;border-bottom:1px solid var(--color-outline);border-left:.25rem solid var(--color-secondary)}.pair.positive{border-left-color:#B04A35}.pair.negative{border-left-color:#346797}.pair strong{display:block}.pair span{font-variant-numeric:tabular-nums;font-family:var(--font-mono)}.note{margin-top:1rem;padding:1rem;background:var(--color-surface-subtle);color:var(--color-secondary)}@media(max-width:640px){.correlation{padding:1rem}.correlation h1{font-size:var(--text-h3)}.plot{display:none}.pair-list{grid-template-columns:minmax(0,1fr);gap:.25rem}.pair{min-width:0;overflow-wrap:anywhere}}`}</style>
    <header><p className="muted">CORRELATION MATRIX · 相関は因果を意味しない</p><h1>{titleLines.map((line, i) => <span key={i}>{line}{i + 1 < titleLines.length && <br />}</span>)}</h1>{d.subtitle && <p className="muted">{d.subtitle}</p>}</header>
    <svg className="plot" data-layout-still="true" xmlns="http://www.w3.org/2000/svg" width="1280" height="720" viewBox="0 0 1280 720" role="img" aria-label="指標間の相関係数を正負の色で示す対称行列">
      <rect width="1280" height="720" fill="var(--color-surface)" />
      {titleLines.map((line, i) => <text key={`title-${i}`} className="svg-title" x="64" y={titleY + i * 23} fontSize="20" fontWeight="700" fill="var(--color-on-surface)">{line}</text>)}
      {subtitleLines.map((line, i) => <text key={`subtitle-${i}`} className="svg-subtitle" x="64" y={subtitleY + i * 18} fontSize="14" fill="var(--color-secondary)">{line}</text>)}
      {columnLabels.map((lines, j) => lines.map((line, i) => <text key={`col-${j}-${i}`} x={gridX + j * cell + cell / 2} y={gridY - 43 + i * 15} textAnchor="middle" fontSize="11" fontWeight="700" fill="var(--color-on-surface)">{line}</text>))}
      {d.variables.map((name, i) => <text key={`row-${i}`} x={labelX} y={gridY + i * cell + cell / 2 + 4} textAnchor="end" fontSize="12" fill="var(--color-on-surface)">{name}</text>)}
      {d.variables.flatMap((row, i) => d.variables.map((column, j) => {
        const value = matrixValue(i, j);
        const x = gridX + j * cell;
        const y = gridY + i * cell;
        const fill = i === j ? "#E4E9EE" : color(value);
        return <g key={joinIds(row, column)} data-pair-cell={i < j ? "true" : undefined}>
          <rect x={x} y={y} width={cell} height={cell} fill={fill} stroke="var(--color-surface)" strokeWidth="2" />
          <text x={x + cell / 2} y={y + cell / 2 + 5} textAnchor="middle" fontSize={cell < 58 ? "11" : "15"} fontWeight="600" fill={i === j || Math.abs(value) < 0.85 ? "var(--color-on-surface)" : "#FFFFFF"}>{i === j ? "1.000" : fmt(value)}</text>
        </g>;
      }))}
      <text x="64" y="704" fontSize="13" fill="var(--color-secondary)">対角は自己相関1.00。濃さは相関の強さ、青と赤は負・正の方向を表す。相関から因果は分からない。</text>
    </svg>
    <div className="pair-list">{variablePairs.map(pair => <article key={joinIds(pair.row, pair.column)} className={`pair ${pair.sign}`} data-pair-row><strong>{pair.row} × {pair.column}</strong><span>{fmt(pair.coefficient)}</span></article>)}</div>
    <p className="note">相関係数は二指標の線形な関連を要約します。対象期間や集団が異なる値は比較せず、相関を因果として解釈しないでください。</p>
  </section>;
}
/designs/correlation-matrix/source/schema.ts
import { z } from "zod";

const text = z.string().trim().min(1).max(160);
const label = z.string().trim().min(1).max(12);
const coefficient = z.number().finite().min(-1).max(1)
  .refine(value => Math.abs(value * 1000 - Math.round(value * 1000)) < 1e-8, "相関係数は小数第3位まで");
const unique = (values: string[]) => new Set(values).size === values.length;

export const schema = z.object({
  title: text.describe("相関の傾向を要約する見出し"),
  subtitle: text.optional().describe("対象・測定条件・時点"),
  variables: z.array(label.describe("指標名")).min(3).max(8).describe("相関を比較する指標"),
  pairs: z.array(z.object({
    row: label.describe("行側の指標"),
    column: label.describe("列側の指標"),
    coefficient: coefficient.describe("相関係数。-1から+1"),
  }).strict()).describe("対称行列の上三角にある各ペアを一度ずつ指定"),
}).strict().superRefine((data, ctx) => {
  if (!unique(data.variables)) ctx.addIssue({ code: "custom", path: ["variables"], message: "指標名は重複しない" });
  const indices = new Map(data.variables.map((name, index) => [name, index]));
  const keys: string[] = [];
  data.pairs.forEach((pair, index) => {
    const row = indices.get(pair.row);
    const column = indices.get(pair.column);
    if (row === undefined || column === undefined || row >= column) {
      ctx.addIssue({ code: "custom", path: ["pairs", index], message: "ペアはvariables順の上三角(rowより後のcolumn)で指定する" });
    } else keys.push(`${row}:${column}`);
  });
  if (!unique(keys)) ctx.addIssue({ code: "custom", path: ["pairs"], message: "各指標ペアは一度だけ指定する" });
  const expected = data.variables.length * (data.variables.length - 1) / 2;
  if (data.pairs.length !== expected || keys.length !== expected) {
    ctx.addIssue({ code: "custom", path: ["pairs"], message: `異なる指標の組み合わせをすべて一度ずつ入力する(${expected}件)` });
  }
});

export type Props = z.infer<typeof schema>;
/designs/correlation-matrix/source/meta.yaml
id: correlation-matrix
name:
  ja: 相関行列
  en: Correlation Matrix
purpose:
  ja: 複数指標の相関係数を対称行列で示し、正負の関係と強さを比較する。
  en: Compare the direction and strength of pairwise relationships in a symmetric matrix.
status: published
still: ./still.png
category: analysis
catalogOrder: 760
jobs:
  - measure-change
  - prioritize-diagnose
useCases:
  - comparison
  - kpi
layoutKinds:
  - matrix
tags:
  - correlation
  - matrix
  - pairwise-relationships
  - offline
  - responsive
whenToUse:
  - ja: 3〜8指標の相関係数を一望し、強い正負の組み合わせを探す。
    en: Use to scan correlations across 3 to 8 variables and find strong positive or negative pairs.
  - ja: 相関行列の対称性と対角の自己相関1を前提に、組み合わせを読む。
    en: Use when the data are pairwise correlations with a symmetric structure and a unit diagonal.
avoidWhen:
  - ja: 相関を因果関係や施策効果として解釈する場合。
    en: Do not interpret correlation as causation or intervention effect.
  - ja: 個別の観測値や時系列順序を比較する場合。
    en: Use another chart when individual observations or temporal order matter.
requiredInputs:
  - ja: 指標名と異なる指標の組み合わせごとに相関係数を一度ずつ指定する。対角1と対称側は自動で補う。
    en: Supply each distinct variable pair once; the chart derives the unit diagonal and symmetric half.
  - ja: 相関係数は-1〜+1、小数第3位まで。測定条件と対象期間を揃え、架空例以外では出典を明記する。
    en: Correlations range from -1 to +1 with up to three decimal places; align measurement conditions and state sources for non-fictional data.
relatedLayouts:
  - heatmap
  - scatter-relationship
dataSchema:
  title: string — 相関の傾向を要約する見出し
  subtitle: string? — 対象・測定条件・時点
  variables: array — 指標名、3〜8件
  pairs: array (row, column, coefficient) — 異なる指標の全ペア。係数は-1〜+1、小数第3位まで
sources: []
/designs/correlation-matrix/source/sample-data.json
{
  "title": "稼働率と初回解決率は正に、応答時間とは負に関連",
  "subtitle": "架空のサポート運用データ|同じ対象期間で算出した相関係数",
  "variables": ["稼働率", "一次解決率", "応答時間", "再訪率", "満足度"],
  "pairs": [
    { "row": "稼働率", "column": "一次解決率", "coefficient": 0.64 },
    { "row": "稼働率", "column": "応答時間", "coefficient": -0.34 },
    { "row": "稼働率", "column": "再訪率", "coefficient": -0.46 },
    { "row": "稼働率", "column": "満足度", "coefficient": 0.42 },
    { "row": "一次解決率", "column": "応答時間", "coefficient": -0.14 },
    { "row": "一次解決率", "column": "再訪率", "coefficient": -0.29 },
    { "row": "一次解決率", "column": "満足度", "coefficient": 0.30 },
    { "row": "応答時間", "column": "再訪率", "coefficient": 0.77 },
    { "row": "応答時間", "column": "満足度", "coefficient": -0.57 },
    { "row": "再訪率", "column": "満足度", "coefficient": -0.57 }
  ]
}