版の配色
1920 × 1080 作品として見る 版そのものを描画 — どの倍率でも字は潰れません 骨格・余白・カラムを重ねた状態
1920 × 1080 作品として見る 版そのものを描画 — どの倍率でも字は潰れません 骨格・余白・カラムを重ねた状態
コピーして貼るか、ファイルに保存して渡す。ネットにつながらない環境には「全部入り」を 1 つ渡せば足りる。
このパネルの中身を、URL の先にあるファイルの中身まで含めて 1 つにまとめた Markdown — 大きいのでファイルで渡す(コピーは 32KB まで)
以下の仕様でスライドを 1 枚作ってください。

- 版面 1920 × 1080
- 余白 上 96 右 140 下 96 左 140

## 文字(版面 1920px に対する px)
title  44px / 700 / 字間 0.01em / 行送り 1.3
window  20px / 500 / 行送り 1.5
value  24px / 700 / 等幅数字
cohort  25px / 700
axisLabel  20px / 500
legend  22px / 500
conclusion  26px / 500 / 行送り 1.6
note  16px / 400 / 行送り 1.6

## 配色
地 #FFFFFF / 面 #F4F6F9 / 文字 #131820 / 補助 #667183 / 強調 #1F5FA8 / 罫 #DBE1E9 / #2F6FB5 / #A85A2E

## 外すと崩れる点
- 男女は中央から左右へ同じ尺度で描く。片側の幅を変えると、男女差と人口比の両方が変わって見える
- 値は各年齢層が総人口に占める割合と明記する。男女それぞれの合計を 100% と誤解させない
- 年齢階級は 3 つにまとめ、左右の値と対応する中央ラベルを同じ高さに揃える
- 年齢階級の幅が違うので階級内の人口密度を比べない。各値は総人口比だけを表す
- 架空データであることを明記し、実際の地域統計と取り違えさせない

内容は[ここに自分の内容を書く]に置き換えてください。寸法と配色はそのまま守ってください。
正確に再現する場合は、この HTML をそのまま使ってください: https://design-vault.pages.dev/designs/population-pyramid-age-structure/pattern.html
/ai/designs/population-pyramid-age-structure.json
format: slide-16x9
density: medium
layout:
  kind: axis
  canvas:
    w: 1920
    h: 1080
  margin:
    top: 96
    right: 140
    bottom: 96
    left: 140
type:
  title:
    size: 44
    weight: 700
    tracking: 0.01em
    leading: 1.3
  window:
    size: 20
    weight: 500
    leading: 1.5
  value:
    size: 24
    weight: 700
    numeric: tabular
  cohort:
    size: 25
    weight: 700
  axisLabel:
    size: 20
    weight: 500
  legend:
    size: 22
    weight: 500
  conclusion:
    size: 26
    weight: 500
    leading: 1.6
  note:
    size: 16
    weight: 400
    leading: 1.6
colors:
  ground: "#FFFFFF"
  surface: "#F4F6F9"
  ink: "#131820"
  muted: "#667183"
  accent: "#1F5FA8"
  rule: "#DBE1E9"
  series:
    - "#2F6FB5"
    - "#A85A2E"
rules:
  - 男女は中央から左右へ同じ尺度で描く。片側の幅を変えると、男女差と人口比の両方が変わって見える
  - 値は各年齢層が総人口に占める割合と明記する。男女それぞれの合計を 100% と誤解させない
  - 年齢階級は 3 つにまとめ、左右の値と対応する中央ラベルを同じ高さに揃える
  - 年齢階級の幅が違うので階級内の人口密度を比べない。各値は総人口比だけを表す
  - 架空データであることを明記し、実際の地域統計と取り違えさせない
{
"format": "slide-16x9",
"density": "medium",
"layout": {
"kind": "axis",
"canvas": {
"w": 1920,
"h": 1080
},
"margin": {
"top": 96,
"right": 140,
"bottom": 96,
"left": 140
}
},
"type": {
"title": {
"size": 44,
"weight": 700,
"tracking": "0.01em",
"leading": 1.3
},
"window": {
"size": 20,
"weight": 500,
"leading": 1.5
},
"value": {
"size": 24,
"weight": 700,
"numeric": "tabular"
},
"cohort": {
"size": 25,
"weight": 700
},
"axisLabel": {
"size": 20,
"weight": 500
},
"legend": {
"size": 22,
"weight": 500
},
"conclusion": {
"size": 26,
"weight": 500,
"leading": 1.6
},
"note": {
"size": 16,
"weight": 400,
"leading": 1.6
}
},
"colors": {
"ground": "#FFFFFF",
"surface": "#F4F6F9",
"ink": "#131820",
"muted": "#667183",
"accent": "#1F5FA8",
"rule": "#DBE1E9",
"series": [
"#2F6FB5",
"#A85A2E"
]
},
"rules": [
"男女は中央から左右へ同じ尺度で描く。片側の幅を変えると、男女差と人口比の両方が変わって見える",
"値は各年齢層が総人口に占める割合と明記する。男女それぞれの合計を 100% と誤解させない",
"年齢階級は 3 つにまとめ、左右の値と対応する中央ラベルを同じ高さに揃える",
"年齢階級の幅が違うので階級内の人口密度を比べない。各値は総人口比だけを表す",
"架空データであることを明記し、実際の地域統計と取り違えさせない"
]
} /designs/population-pyramid-age-structure/pattern.html — 版そのものの HTML。書体の部分集合ごと同梱で、開けばこの絵がそのまま出ます。
<!doctype html>
<meta charset="utf-8">
<title>人口構成 — 働き手世代が過半を占める</title>
<meta name="dv-font" content="Zen Kaku Gothic New:400;500;700">
<link rel="stylesheet" href="./font.css">
<style>
  :root {
    --ground: #FFFFFF;
    --surface: #F4F6F9;
    --ink: #131820;
    --muted: #667183;
    --accent: #1F5FA8;
    --rule: #DBE1E9;
    --series-1: #2F6FB5;
    --series-2: #A85A2E;
  }

  * { box-sizing: border-box; margin: 0; }
  html, body { width: 1920px; height: 1080px; }
  body { font-family: "Zen Kaku Gothic New", "IPAGothic", sans-serif; }

  .artboard {
    width: 1920px;
    height: 1080px;
    padding: 96px 140px;
    color: var(--ink);
    background: var(--ground);
  }

  .content { height: 100%; display: grid; grid-template-rows: auto minmax(0, 1fr) auto; }
  .head { border-bottom: 2px solid var(--rule); padding-bottom: 28px; }
  .title { font-size: 44px; font-weight: 700; letter-spacing: 0.01em; line-height: 1.3; }
  .window { margin-top: 14px; color: var(--muted); font-size: 20px; font-weight: 500; line-height: 1.5; }
  .body { display: grid; grid-template-rows: auto auto; align-content: center; justify-items: center; row-gap: 26px; }
  .figure { display: block; }
  .gridline { stroke: var(--rule); stroke-width: 1.5; }
  .baseline { stroke: var(--ink); stroke-width: 2; }
  .male { fill: var(--series-1); }
  .female { fill: var(--series-2); }
  .axis-label { fill: var(--muted); font-size: 20px; font-weight: 500; }
  .cohort { fill: var(--ink); font-size: 25px; font-weight: 700; }
  .value { fill: var(--ink); font-size: 24px; font-weight: 700; font-variant-numeric: tabular-nums; }
  .legend { fill: var(--ink); font-size: 22px; font-weight: 500; }
  .legend-male { fill: var(--series-1); }
  .legend-female { fill: var(--series-2); }
  .conclusion { color: var(--muted); font-size: 26px; font-weight: 500; line-height: 1.6; }
  .foot { border-top: 1px solid var(--rule); padding-top: 22px; color: var(--muted); font-size: 16px; line-height: 1.6; }
</style>

<div class="artboard" data-artboard>
  <div class="content" data-content>
    <div class="head">
      <h1 class="title" data-type="title">人口構成 — 働き手世代が過半を占める</h1>
      <p class="window" data-type="window">架空の市の人口構成 / 各年齢層の人口が総人口に占める割合 / 男女別</p>
    </div>

    <div class="body">
      <svg class="figure" width="1260" height="540" viewBox="0 0 1260 540" aria-label="男女別人口構成。0から19歳は男性12%、女性11%。20から64歳は男性26%、女性27%。65歳以上は男性10%、女性14%。">
        <!-- 同じ母数の割合を中央の0から左右へ伸ばす。面積ではなく長さが割合を表す。 -->
        <line class="gridline" x1="230" y1="100" x2="230" y2="440"/>
        <line class="gridline" x1="330" y1="100" x2="330" y2="440"/>
        <line class="gridline" x1="430" y1="100" x2="430" y2="440"/>
        <line class="gridline" x1="830" y1="100" x2="830" y2="440"/>
        <line class="gridline" x1="930" y1="100" x2="930" y2="440"/>
        <line class="gridline" x1="1030" y1="100" x2="1030" y2="440"/>
        <line class="baseline" x1="530" y1="100" x2="530" y2="440"/>
        <line class="baseline" x1="730" y1="100" x2="730" y2="440"/>

        <!-- 3 broad age cohorts keep the paired shape legible at slide scale. -->
        <rect class="male" x="410" y="150" width="120" height="46" rx="4"/>
        <rect class="female" x="730" y="150" width="110" height="46" rx="4"/>
        <text class="value" data-type="value" x="396" y="173" text-anchor="end" dominant-baseline="central">12%</text>
        <text class="value" x="854" y="173" text-anchor="start" dominant-baseline="central">11%</text>

        <rect class="male" x="270" y="270" width="260" height="46" rx="4"/>
        <rect class="female" x="730" y="270" width="270" height="46" rx="4"/>
        <text class="value" x="256" y="293" text-anchor="end" dominant-baseline="central">26%</text>
        <text class="value" x="1014" y="293" text-anchor="start" dominant-baseline="central">27%</text>

        <rect class="male" x="430" y="390" width="100" height="46" rx="4"/>
        <rect class="female" x="730" y="390" width="140" height="46" rx="4"/>
        <text class="value" x="416" y="413" text-anchor="end" dominant-baseline="central">10%</text>
        <text class="value" x="884" y="413" text-anchor="start" dominant-baseline="central">14%</text>

        <text class="cohort" data-type="cohort" x="630" y="173" text-anchor="middle" dominant-baseline="central">0–19 歳</text>
        <text class="cohort" x="630" y="293" text-anchor="middle" dominant-baseline="central">20–64 歳</text>
        <text class="cohort" x="630" y="413" text-anchor="middle" dominant-baseline="central">65 歳以上</text>

        <text class="axis-label" data-type="axisLabel" x="230" y="68" text-anchor="middle" dominant-baseline="central">30%</text>
        <text class="axis-label" x="330" y="68" text-anchor="middle" dominant-baseline="central">20%</text>
        <text class="axis-label" x="430" y="68" text-anchor="middle" dominant-baseline="central">10%</text>
        <text class="axis-label" x="530" y="68" text-anchor="middle" dominant-baseline="central">0</text>
        <text class="axis-label" x="730" y="68" text-anchor="middle" dominant-baseline="central">0</text>
        <text class="axis-label" x="830" y="68" text-anchor="middle" dominant-baseline="central">10%</text>
        <text class="axis-label" x="930" y="68" text-anchor="middle" dominant-baseline="central">20%</text>
        <text class="axis-label" x="1030" y="68" text-anchor="middle" dominant-baseline="central">30%</text>

        <rect class="male" x="468" y="516" width="22" height="16" rx="2"/>
        <text class="legend" data-type="legend" x="502" y="524" dominant-baseline="central">男性</text>
        <rect class="female" x="656" y="516" width="22" height="16" rx="2"/>
        <text class="legend" x="690" y="524" dominant-baseline="central">女性</text>
      </svg>
      <p class="conclusion" data-type="conclusion">20〜64 歳が 53% を占める一方、若年層と 65 歳以上はほぼ同じ規模</p>
    </div>

    <div class="foot" data-type="note">架空データ。各値は総人口比で、左右の長さは同じ 0〜30% 尺度。年齢階級の幅が異なるため、階級内の人口密度は比較しない。</div>
  </div>
</div>
/designs/population-pyramid-age-structure/font.css — 全部入りには入れていない
/* dv-subset v2 — generated by scripts/subset-font.mjs. Do not edit.
 * font    Zen Kaku Gothic New 400;500;700
 * chars   85 (3755547554954715)
 *
 * pattern.html の文字だけを含む部分集合。描画時に外部へ取りに行かないよう同梱する。
 * 版の文字を変えたら取り直すこと — 忘れると足りない字が豆腐になる。
 * その取り忘れは pattern-entries.test.ts が上の指紋で検出する。
 */

@font-face {
  font-family: 'Zen Kaku Gothic New';
  font-style: normal;
  font-weight: 400;
  font-display: block;
  src: url(./font-0.woff2) format('woff2');
  unicode-range: U+25, U+2f-37, U+39, U+2013-2014, U+3001-3002, U+301c, U+3044, U+304b-304e, U+3055-3058, U+305f-3060, U+3066-306b, U+306e-3070, U+307b-307c, U+3081, U+308b, U+3092, U+3099, U+30bf-30c0, U+30c6-30c7, U+30fc, U+4e00, U+4e0a, U+4e16, U+4eba, U+4ee3, U+4ee5, U+5024, U+50cd, U+5185, U+5225, U+5272, U+534a, U+5360, U+53e3, U+53f3, U+5404, U+5408, U+540c, U+5973, U+5bc6, U+5c3a, U+5c64, U+5de6, U+5e02, U+5e45, U+5e74, U+5ea6, U+6027, U+6210, U+624b, U+65b9, U+67b6, U+69cb, U+6a21, U+6b73, U+6bd4, U+7537, U+7570, U+7a7a, U+7d1a, U+7dcf, U+82e5, U+898f, U+8f03, U+904e, U+9577, U+968e, U+9f62;
}
@font-face {
  font-family: 'Zen Kaku Gothic New';
  font-style: normal;
  font-weight: 500;
  font-display: block;
  src: url(./font-1.woff2) format('woff2');
  unicode-range: U+25, U+2f-37, U+39, U+2013-2014, U+3001-3002, U+301c, U+3044, U+304b-304e, U+3055-3058, U+305f-3060, U+3066-306b, U+306e-3070, U+307b-307c, U+3081, U+308b, U+3092, U+3099, U+30bf-30c0, U+30c6-30c7, U+30fc, U+4e00, U+4e0a, U+4e16, U+4eba, U+4ee3, U+4ee5, U+5024, U+50cd, U+5185, U+5225, U+5272, U+534a, U+5360, U+53e3, U+53f3, U+5404, U+5408, U+540c, U+5973, U+5bc6, U+5c3a, U+5c64, U+5de6, U+5e02, U+5e45, U+5e74, U+5ea6, U+6027, U+6210, U+624b, U+65b9, U+67b6, U+69cb, U+6a21, U+6b73, U+6bd4, U+7537, U+7570, U+7a7a, U+7d1a, U+7dcf, U+82e5, U+898f, U+8f03, U+904e, U+9577, U+968e, U+9f62;
}
@font-face {
  font-family: 'Zen Kaku Gothic New';
  font-style: normal;
  font-weight: 700;
  font-display: block;
  src: url(./font-2.woff2) format('woff2');
  unicode-range: U+25, U+2f-37, U+39, U+2013-2014, U+3001-3002, U+301c, U+3044, U+304b-304e, U+3055-3058, U+305f-3060, U+3066-306b, U+306e-3070, U+307b-307c, U+3081, U+308b, U+3092, U+3099, U+30bf-30c0, U+30c6-30c7, U+30fc, U+4e00, U+4e0a, U+4e16, U+4eba, U+4ee3, U+4ee5, U+5024, U+50cd, U+5185, U+5225, U+5272, U+534a, U+5360, U+53e3, U+53f3, U+5404, U+5408, U+540c, U+5973, U+5bc6, U+5c3a, U+5c64, U+5de6, U+5e02, U+5e45, U+5e74, U+5ea6, U+6027, U+6210, U+624b, U+65b9, U+67b6, U+69cb, U+6a21, U+6b73, U+6bd4, U+7537, U+7570, U+7a7a, U+7d1a, U+7dcf, U+82e5, U+898f, U+8f03, U+904e, U+9577, U+968e, U+9f62;
}
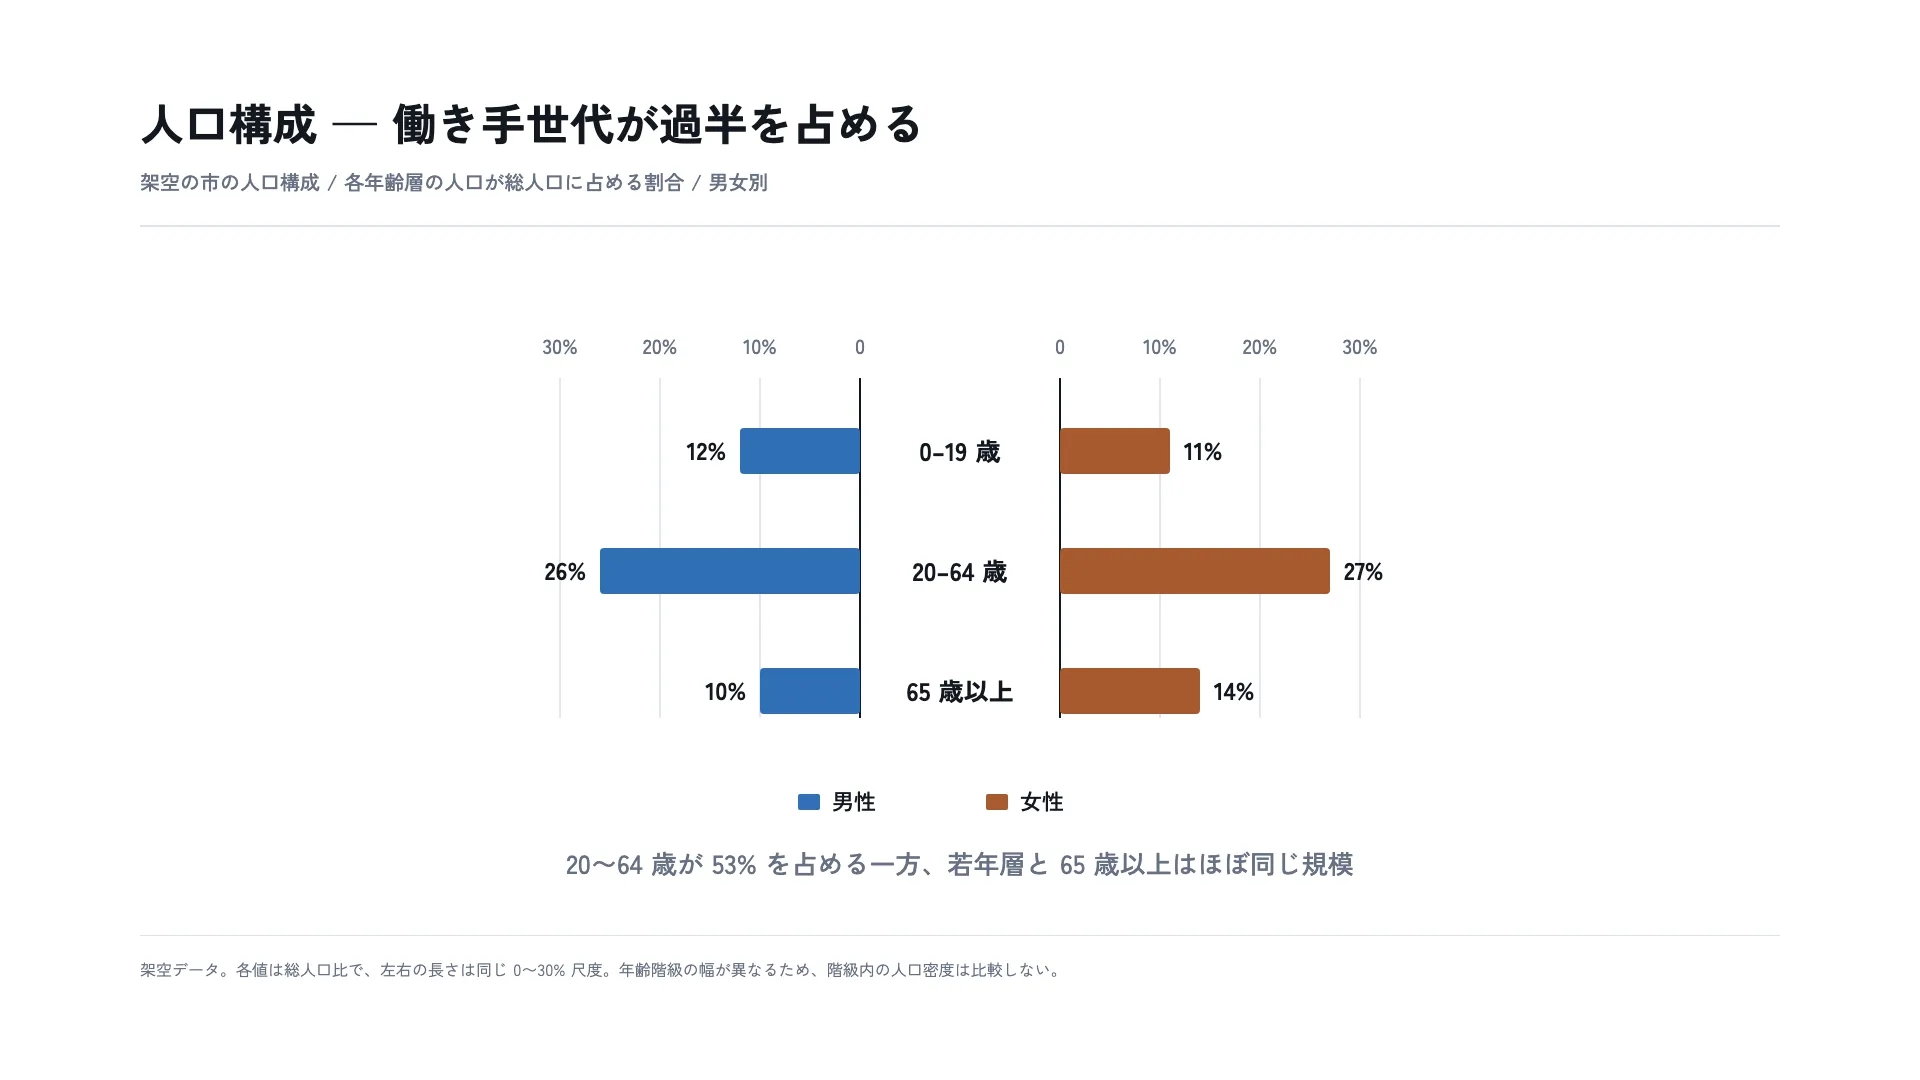
左右に分かれた帯の形は、年齢が上がるにつれて男女の人口構成がどう変わるかを同じ目盛りで 比べるためのもの。左右それぞれの値が総人口に対する割合なので、男女の差と年齢層の厚みを 一目で見比べられる。
この例では、働き手世代が 53% と最も厚く、若年層 23% と 65 歳以上 24% はほぼ同じ規模である。 母数と地域を特定しない架空の値を使い、実際の人口統計についての主張とは切り分けている。