As measured
1920 × 1080 Seen as a design The artboard itself, drawn live — sharp at any zoom Structure, margins and columns overlaid
1920 × 1080 Seen as a design The artboard itself, drawn live — sharp at any zoom Structure, margins and columns overlaid
Copy and paste, or save a file and hand it over. For a machine with no network, one “Everything” file is enough.
Everything in this panel, including the contents behind each URL, in one Markdown file — Large, so it goes as a file (copy is for 32 KB and under)
Produce one slide to the following specification.

- Canvas 1920 × 1080
- Margin top 96 right 140 bottom 96 left 140

## Type (px against a 1920px canvas)
title  44px / 700 / tracking 0.01em / leading 1.3
window  20px / 500 / leading 1.5
value  24px / 700 / tabular numerals
cohort  25px / 700
axisLabel  20px / 500
legend  22px / 500
conclusion  26px / 500 / leading 1.6
note  16px / 400 / leading 1.6

## Colour
Ground #FFFFFF / Surface #F4F6F9 / Ink #131820 / Muted #667183 / Accent #1F5FA8 / Rule #DBE1E9 / #2F6FB5 / #A85A2E

## Constraints — dropping these breaks it
- Use the same scale on both sides of the centre. Different scales would distort both the sex gap and the population shares.
- State that each value is a share of the total population; the two sides do not each sum to 100%.
- Keep the age groups to three broad bands and align the centre label with both corresponding values.
- The age bands have unequal widths, so do not compare within-band density. Each value shows only its share of the total.
- Label the data as fictional so it cannot be mistaken for an actual region's statistics.

Replace the content with [your content]. Keep the measurements and colours as given.
For an exact reproduction, use the verbatim HTML at https://design-vault.pages.dev/designs/population-pyramid-age-structure/pattern.html.
/ai/designs/population-pyramid-age-structure.json
format: slide-16x9
density: medium
layout:
  kind: axis
  canvas:
    w: 1920
    h: 1080
  margin:
    top: 96
    right: 140
    bottom: 96
    left: 140
type:
  title:
    size: 44
    weight: 700
    tracking: 0.01em
    leading: 1.3
  window:
    size: 20
    weight: 500
    leading: 1.5
  value:
    size: 24
    weight: 700
    numeric: tabular
  cohort:
    size: 25
    weight: 700
  axisLabel:
    size: 20
    weight: 500
  legend:
    size: 22
    weight: 500
  conclusion:
    size: 26
    weight: 500
    leading: 1.6
  note:
    size: 16
    weight: 400
    leading: 1.6
colors:
  ground: "#FFFFFF"
  surface: "#F4F6F9"
  ink: "#131820"
  muted: "#667183"
  accent: "#1F5FA8"
  rule: "#DBE1E9"
  series:
    - "#2F6FB5"
    - "#A85A2E"
rules:
  - Use the same scale on both sides of the centre. Different scales would distort both the sex gap and the population shares.
  - State that each value is a share of the total population; the two sides do not each sum to 100%.
  - Keep the age groups to three broad bands and align the centre label with both corresponding values.
  - The age bands have unequal widths, so do not compare within-band density. Each value shows only its share of the total.
  - Label the data as fictional so it cannot be mistaken for an actual region's statistics.
{
"format": "slide-16x9",
"density": "medium",
"layout": {
"kind": "axis",
"canvas": {
"w": 1920,
"h": 1080
},
"margin": {
"top": 96,
"right": 140,
"bottom": 96,
"left": 140
}
},
"type": {
"title": {
"size": 44,
"weight": 700,
"tracking": "0.01em",
"leading": 1.3
},
"window": {
"size": 20,
"weight": 500,
"leading": 1.5
},
"value": {
"size": 24,
"weight": 700,
"numeric": "tabular"
},
"cohort": {
"size": 25,
"weight": 700
},
"axisLabel": {
"size": 20,
"weight": 500
},
"legend": {
"size": 22,
"weight": 500
},
"conclusion": {
"size": 26,
"weight": 500,
"leading": 1.6
},
"note": {
"size": 16,
"weight": 400,
"leading": 1.6
}
},
"colors": {
"ground": "#FFFFFF",
"surface": "#F4F6F9",
"ink": "#131820",
"muted": "#667183",
"accent": "#1F5FA8",
"rule": "#DBE1E9",
"series": [
"#2F6FB5",
"#A85A2E"
]
},
"rules": [
"Use the same scale on both sides of the centre. Different scales would distort both the sex gap and the population shares.",
"State that each value is a share of the total population; the two sides do not each sum to 100%.",
"Keep the age groups to three broad bands and align the centre label with both corresponding values.",
"The age bands have unequal widths, so do not compare within-band density. Each value shows only its share of the total.",
"Label the data as fictional so it cannot be mistaken for an actual region's statistics."
]
} /designs/population-pyramid-age-structure/pattern.html — The artboard itself, font subset included — open it and this picture draws.
<!doctype html>
<meta charset="utf-8">
<title>人口構成 — 働き手世代が過半を占める</title>
<meta name="dv-font" content="Zen Kaku Gothic New:400;500;700">
<link rel="stylesheet" href="./font.css">
<style>
  :root {
    --ground: #FFFFFF;
    --surface: #F4F6F9;
    --ink: #131820;
    --muted: #667183;
    --accent: #1F5FA8;
    --rule: #DBE1E9;
    --series-1: #2F6FB5;
    --series-2: #A85A2E;
  }

  * { box-sizing: border-box; margin: 0; }
  html, body { width: 1920px; height: 1080px; }
  body { font-family: "Zen Kaku Gothic New", "IPAGothic", sans-serif; }

  .artboard {
    width: 1920px;
    height: 1080px;
    padding: 96px 140px;
    color: var(--ink);
    background: var(--ground);
  }

  .content { height: 100%; display: grid; grid-template-rows: auto minmax(0, 1fr) auto; }
  .head { border-bottom: 2px solid var(--rule); padding-bottom: 28px; }
  .title { font-size: 44px; font-weight: 700; letter-spacing: 0.01em; line-height: 1.3; }
  .window { margin-top: 14px; color: var(--muted); font-size: 20px; font-weight: 500; line-height: 1.5; }
  .body { display: grid; grid-template-rows: auto auto; align-content: center; justify-items: center; row-gap: 26px; }
  .figure { display: block; }
  .gridline { stroke: var(--rule); stroke-width: 1.5; }
  .baseline { stroke: var(--ink); stroke-width: 2; }
  .male { fill: var(--series-1); }
  .female { fill: var(--series-2); }
  .axis-label { fill: var(--muted); font-size: 20px; font-weight: 500; }
  .cohort { fill: var(--ink); font-size: 25px; font-weight: 700; }
  .value { fill: var(--ink); font-size: 24px; font-weight: 700; font-variant-numeric: tabular-nums; }
  .legend { fill: var(--ink); font-size: 22px; font-weight: 500; }
  .legend-male { fill: var(--series-1); }
  .legend-female { fill: var(--series-2); }
  .conclusion { color: var(--muted); font-size: 26px; font-weight: 500; line-height: 1.6; }
  .foot { border-top: 1px solid var(--rule); padding-top: 22px; color: var(--muted); font-size: 16px; line-height: 1.6; }
</style>

<div class="artboard" data-artboard>
  <div class="content" data-content>
    <div class="head">
      <h1 class="title" data-type="title">人口構成 — 働き手世代が過半を占める</h1>
      <p class="window" data-type="window">架空の市の人口構成 / 各年齢層の人口が総人口に占める割合 / 男女別</p>
    </div>

    <div class="body">
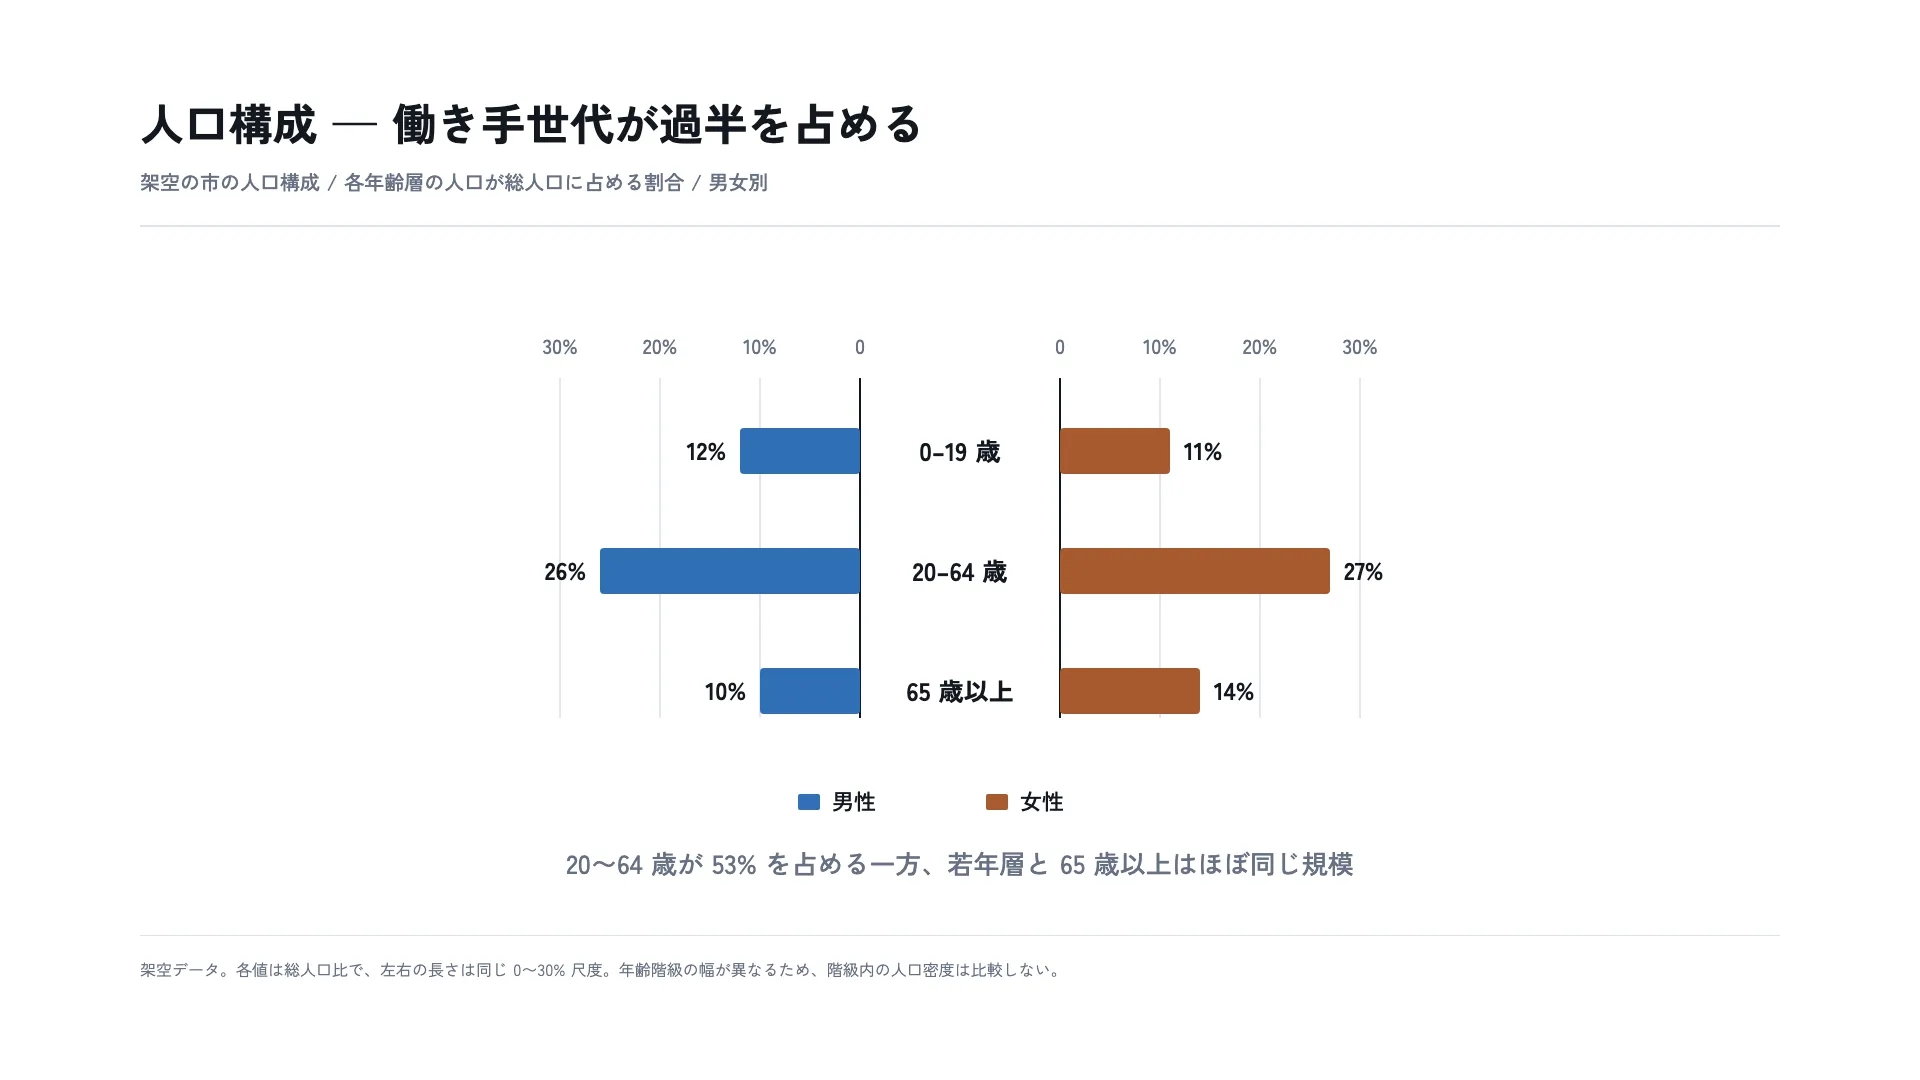
      <svg class="figure" width="1260" height="540" viewBox="0 0 1260 540" aria-label="男女別人口構成。0から19歳は男性12%、女性11%。20から64歳は男性26%、女性27%。65歳以上は男性10%、女性14%。">
        <!-- 同じ母数の割合を中央の0から左右へ伸ばす。面積ではなく長さが割合を表す。 -->
        <line class="gridline" x1="230" y1="100" x2="230" y2="440"/>
        <line class="gridline" x1="330" y1="100" x2="330" y2="440"/>
        <line class="gridline" x1="430" y1="100" x2="430" y2="440"/>
        <line class="gridline" x1="830" y1="100" x2="830" y2="440"/>
        <line class="gridline" x1="930" y1="100" x2="930" y2="440"/>
        <line class="gridline" x1="1030" y1="100" x2="1030" y2="440"/>
        <line class="baseline" x1="530" y1="100" x2="530" y2="440"/>
        <line class="baseline" x1="730" y1="100" x2="730" y2="440"/>

        <!-- 3 broad age cohorts keep the paired shape legible at slide scale. -->
        <rect class="male" x="410" y="150" width="120" height="46" rx="4"/>
        <rect class="female" x="730" y="150" width="110" height="46" rx="4"/>
        <text class="value" data-type="value" x="396" y="173" text-anchor="end" dominant-baseline="central">12%</text>
        <text class="value" x="854" y="173" text-anchor="start" dominant-baseline="central">11%</text>

        <rect class="male" x="270" y="270" width="260" height="46" rx="4"/>
        <rect class="female" x="730" y="270" width="270" height="46" rx="4"/>
        <text class="value" x="256" y="293" text-anchor="end" dominant-baseline="central">26%</text>
        <text class="value" x="1014" y="293" text-anchor="start" dominant-baseline="central">27%</text>

        <rect class="male" x="430" y="390" width="100" height="46" rx="4"/>
        <rect class="female" x="730" y="390" width="140" height="46" rx="4"/>
        <text class="value" x="416" y="413" text-anchor="end" dominant-baseline="central">10%</text>
        <text class="value" x="884" y="413" text-anchor="start" dominant-baseline="central">14%</text>

        <text class="cohort" data-type="cohort" x="630" y="173" text-anchor="middle" dominant-baseline="central">0–19 歳</text>
        <text class="cohort" x="630" y="293" text-anchor="middle" dominant-baseline="central">20–64 歳</text>
        <text class="cohort" x="630" y="413" text-anchor="middle" dominant-baseline="central">65 歳以上</text>

        <text class="axis-label" data-type="axisLabel" x="230" y="68" text-anchor="middle" dominant-baseline="central">30%</text>
        <text class="axis-label" x="330" y="68" text-anchor="middle" dominant-baseline="central">20%</text>
        <text class="axis-label" x="430" y="68" text-anchor="middle" dominant-baseline="central">10%</text>
        <text class="axis-label" x="530" y="68" text-anchor="middle" dominant-baseline="central">0</text>
        <text class="axis-label" x="730" y="68" text-anchor="middle" dominant-baseline="central">0</text>
        <text class="axis-label" x="830" y="68" text-anchor="middle" dominant-baseline="central">10%</text>
        <text class="axis-label" x="930" y="68" text-anchor="middle" dominant-baseline="central">20%</text>
        <text class="axis-label" x="1030" y="68" text-anchor="middle" dominant-baseline="central">30%</text>

        <rect class="male" x="468" y="516" width="22" height="16" rx="2"/>
        <text class="legend" data-type="legend" x="502" y="524" dominant-baseline="central">男性</text>
        <rect class="female" x="656" y="516" width="22" height="16" rx="2"/>
        <text class="legend" x="690" y="524" dominant-baseline="central">女性</text>
      </svg>
      <p class="conclusion" data-type="conclusion">20〜64 歳が 53% を占める一方、若年層と 65 歳以上はほぼ同じ規模</p>
    </div>

    <div class="foot" data-type="note">架空データ。各値は総人口比で、左右の長さは同じ 0〜30% 尺度。年齢階級の幅が異なるため、階級内の人口密度は比較しない。</div>
  </div>
</div>
/designs/population-pyramid-age-structure/font.css — Not in Everything
/* dv-subset v2 — generated by scripts/subset-font.mjs. Do not edit.
 * font    Zen Kaku Gothic New 400;500;700
 * chars   85 (3755547554954715)
 *
 * pattern.html の文字だけを含む部分集合。描画時に外部へ取りに行かないよう同梱する。
 * 版の文字を変えたら取り直すこと — 忘れると足りない字が豆腐になる。
 * その取り忘れは pattern-entries.test.ts が上の指紋で検出する。
 */

@font-face {
  font-family: 'Zen Kaku Gothic New';
  font-style: normal;
  font-weight: 400;
  font-display: block;
  src: url(./font-0.woff2) format('woff2');
  unicode-range: U+25, U+2f-37, U+39, U+2013-2014, U+3001-3002, U+301c, U+3044, U+304b-304e, U+3055-3058, U+305f-3060, U+3066-306b, U+306e-3070, U+307b-307c, U+3081, U+308b, U+3092, U+3099, U+30bf-30c0, U+30c6-30c7, U+30fc, U+4e00, U+4e0a, U+4e16, U+4eba, U+4ee3, U+4ee5, U+5024, U+50cd, U+5185, U+5225, U+5272, U+534a, U+5360, U+53e3, U+53f3, U+5404, U+5408, U+540c, U+5973, U+5bc6, U+5c3a, U+5c64, U+5de6, U+5e02, U+5e45, U+5e74, U+5ea6, U+6027, U+6210, U+624b, U+65b9, U+67b6, U+69cb, U+6a21, U+6b73, U+6bd4, U+7537, U+7570, U+7a7a, U+7d1a, U+7dcf, U+82e5, U+898f, U+8f03, U+904e, U+9577, U+968e, U+9f62;
}
@font-face {
  font-family: 'Zen Kaku Gothic New';
  font-style: normal;
  font-weight: 500;
  font-display: block;
  src: url(./font-1.woff2) format('woff2');
  unicode-range: U+25, U+2f-37, U+39, U+2013-2014, U+3001-3002, U+301c, U+3044, U+304b-304e, U+3055-3058, U+305f-3060, U+3066-306b, U+306e-3070, U+307b-307c, U+3081, U+308b, U+3092, U+3099, U+30bf-30c0, U+30c6-30c7, U+30fc, U+4e00, U+4e0a, U+4e16, U+4eba, U+4ee3, U+4ee5, U+5024, U+50cd, U+5185, U+5225, U+5272, U+534a, U+5360, U+53e3, U+53f3, U+5404, U+5408, U+540c, U+5973, U+5bc6, U+5c3a, U+5c64, U+5de6, U+5e02, U+5e45, U+5e74, U+5ea6, U+6027, U+6210, U+624b, U+65b9, U+67b6, U+69cb, U+6a21, U+6b73, U+6bd4, U+7537, U+7570, U+7a7a, U+7d1a, U+7dcf, U+82e5, U+898f, U+8f03, U+904e, U+9577, U+968e, U+9f62;
}
@font-face {
  font-family: 'Zen Kaku Gothic New';
  font-style: normal;
  font-weight: 700;
  font-display: block;
  src: url(./font-2.woff2) format('woff2');
  unicode-range: U+25, U+2f-37, U+39, U+2013-2014, U+3001-3002, U+301c, U+3044, U+304b-304e, U+3055-3058, U+305f-3060, U+3066-306b, U+306e-3070, U+307b-307c, U+3081, U+308b, U+3092, U+3099, U+30bf-30c0, U+30c6-30c7, U+30fc, U+4e00, U+4e0a, U+4e16, U+4eba, U+4ee3, U+4ee5, U+5024, U+50cd, U+5185, U+5225, U+5272, U+534a, U+5360, U+53e3, U+53f3, U+5404, U+5408, U+540c, U+5973, U+5bc6, U+5c3a, U+5c64, U+5de6, U+5e02, U+5e45, U+5e74, U+5ea6, U+6027, U+6210, U+624b, U+65b9, U+67b6, U+69cb, U+6a21, U+6b73, U+6bd4, U+7537, U+7570, U+7a7a, U+7d1a, U+7dcf, U+82e5, U+898f, U+8f03, U+904e, U+9577, U+968e, U+9f62;
}
左右に分かれた帯の形は、年齢が上がるにつれて男女の人口構成がどう変わるかを同じ目盛りで 比べるためのもの。左右それぞれの値が総人口に対する割合なので、男女の差と年齢層の厚みを 一目で見比べられる。
この例では、働き手世代が 53% と最も厚く、若年層 23% と 65 歳以上 24% はほぼ同じ規模である。 母数と地域を特定しない架空の値を使い、実際の人口統計についての主張とは切り分けている。