版の配色
1920 × 1080 作品として見る 版そのものを描画 — どの倍率でも字は潰れません 骨格・余白・カラムを重ねた状態
1920 × 1080 作品として見る 版そのものを描画 — どの倍率でも字は潰れません 骨格・余白・カラムを重ねた状態
コピーして貼るか、ファイルに保存して渡す。ネットにつながらない環境には「全部入り」を 1 つ渡せば足りる。
このパネルの中身を、URL の先にあるファイルの中身まで含めて 1 つにまとめた Markdown — 大きいのでファイルで渡す(コピーは 32KB まで)
以下の仕様でスライドを 1 枚作ってください。

- 版面 1920 × 1080
- 余白 上 90 右 120 下 40 左 120

## 文字(版面 1920px に対する px)
title  44px / 700 / 字間 0.01em
subtitle  22px / 400
axisTitle  20px / 700
tick  20px / 400
curveLabel  24px / 700
pointLabel  20px / 700
cardLabel  20px / 500
metric  28px / 700
finding  22px / 700
legend  20px / 500
note  20px / 400

## 配色
地 #F7F8F5 / 面 #FFFFFF / 文字 #18232D / 補助 #586875 / 強調 #C64E32 / 罫 #D7DEE1 / #236B9A / #A66019

## 外すと崩れる点
- 需要Dは固定したまま供給をS₀からS₁へ右に移し、均衡点の変化を比べる
- 均衡点から価格軸と数量軸へ投影し、単価と1日量を対応づけて読む
- これは需要と費用など他の条件を一定にした概念モデルで、曲線の傾きは実測値ではない
- 架空値は説明用であり、実市場の価格予測や投資判断には使わない

内容は[ここに自分の内容を書く]に置き換えてください。寸法と配色はそのまま守ってください。
正確に再現する場合は、この HTML をそのまま使ってください: https://design-vault.pages.dev/designs/supply-shift-wholesale-equilibrium/pattern.html
/ai/designs/supply-shift-wholesale-equilibrium.json
format: slide-16x9
density: medium
layout:
  kind: axis
  canvas:
    w: 1920
    h: 1080
  margin:
    top: 90
    right: 120
    bottom: 40
    left: 120
type:
  title:
    size: 44
    weight: 700
    tracking: 0.01em
  subtitle:
    size: 22
    weight: 400
  axisTitle:
    size: 20
    weight: 700
  tick:
    size: 20
    weight: 400
  curveLabel:
    size: 24
    weight: 700
  pointLabel:
    size: 20
    weight: 700
  cardLabel:
    size: 20
    weight: 500
  metric:
    size: 28
    weight: 700
  finding:
    size: 22
    weight: 700
  legend:
    size: 20
    weight: 500
  note:
    size: 20
    weight: 400
colors:
  ground: "#F7F8F5"
  surface: "#FFFFFF"
  ink: "#18232D"
  muted: "#586875"
  accent: "#C64E32"
  rule: "#D7DEE1"
  series:
    - "#236B9A"
    - "#A66019"
rules:
  - 需要Dは固定したまま供給をS₀からS₁へ右に移し、均衡点の変化を比べる
  - 均衡点から価格軸と数量軸へ投影し、単価と1日量を対応づけて読む
  - これは需要と費用など他の条件を一定にした概念モデルで、曲線の傾きは実測値ではない
  - 架空値は説明用であり、実市場の価格予測や投資判断には使わない
{
"format": "slide-16x9",
"density": "medium",
"layout": {
"kind": "axis",
"canvas": {
"w": 1920,
"h": 1080
},
"margin": {
"top": 90,
"right": 120,
"bottom": 40,
"left": 120
}
},
"type": {
"title": {
"size": 44,
"weight": 700,
"tracking": "0.01em"
},
"subtitle": {
"size": 22,
"weight": 400
},
"axisTitle": {
"size": 20,
"weight": 700
},
"tick": {
"size": 20,
"weight": 400
},
"curveLabel": {
"size": 24,
"weight": 700
},
"pointLabel": {
"size": 20,
"weight": 700
},
"cardLabel": {
"size": 20,
"weight": 500
},
"metric": {
"size": 28,
"weight": 700
},
"finding": {
"size": 22,
"weight": 700
},
"legend": {
"size": 20,
"weight": 500
},
"note": {
"size": 20,
"weight": 400
}
},
"colors": {
"ground": "#F7F8F5",
"surface": "#FFFFFF",
"ink": "#18232D",
"muted": "#586875",
"accent": "#C64E32",
"rule": "#D7DEE1",
"series": [
"#236B9A",
"#A66019"
]
},
"rules": [
"需要Dは固定したまま供給をS₀からS₁へ右に移し、均衡点の変化を比べる",
"均衡点から価格軸と数量軸へ投影し、単価と1日量を対応づけて読む",
"これは需要と費用など他の条件を一定にした概念モデルで、曲線の傾きは実測値ではない",
"架空値は説明用であり、実市場の価格予測や投資判断には使わない"
]
} /designs/supply-shift-wholesale-equilibrium/pattern.html — 版そのものの HTML。書体の部分集合ごと同梱で、開けばこの絵がそのまま出ます。
<!doctype html>
<meta charset="utf-8">
<title>冷凍庫の増設で供給増 — 卸値は下がり取扱量は増える</title>
<meta name="dv-font" content="Zen Kaku Gothic New:400;500;700">
<link rel="stylesheet" href="./font.css">
<style>
  :root {
    --ground: #F7F8F5;
    --surface: #FFFFFF;
    --ink: #18232D;
    --muted: #586875;
    --accent: #C64E32;
    --rule: #D7DEE1;
    --series-1: #236B9A;
    --series-2: #A66019;
  }
  * { box-sizing: border-box; margin: 0; }
  html, body { width: 1920px; height: 1080px; }
  body { font-family: "Zen Kaku Gothic New", "IPAGothic", sans-serif; }
</style>
<svg xmlns="http://www.w3.org/2000/svg" width="1920" height="1080" viewBox="0 0 1920 1080" role="img" aria-labelledby="market-title market-desc" data-artboard="true">
  <title id="market-title">供給の増加による卸売市場の均衡変化</title>
  <desc id="market-desc">需要曲線は変わらず、供給曲線が右へ移動する概念図。均衡取扱量は1日70箱から120箱へ増え、価格は1箱1000円から800円へ下がる。</desc>
  <style>
    text { font-family: "Zen Kaku Gothic New", "IPAGothic", sans-serif; }
    .ground { fill: var(--ground); }
    .surface { fill: var(--surface); }
    .ink { fill: var(--ink); }
    .muted { fill: var(--muted); }
    .rule { stroke: var(--rule); }
    .title { font-size: 44px; font-weight: 700; letter-spacing: .01em; }
    .subtitle { font-size: 22px; font-weight: 400; }
    .axis-title { font-size: 20px; font-weight: 700; }
    .tick { font-size: 20px; font-weight: 400; }
    .curve-label { font-size: 24px; font-weight: 700; }
    .point-label { font-size: 20px; font-weight: 700; }
    .card-label { font-size: 20px; font-weight: 500; }
    .metric { font-size: 28px; font-weight: 700; }
    .finding { font-size: 22px; font-weight: 700; }
    .legend { font-size: 20px; font-weight: 500; }
    .note { font-size: 20px; font-weight: 400; }
  </style>
  <defs><clipPath id="plot-area-clip"><rect x="350" y="300" width="1050" height="500"/></clipPath></defs>
  <rect class="ground" width="1920" height="1080"/>
  <g data-content="true">
    <rect x="120" y="90" width="1680" height="950" fill="none" aria-hidden="true"/>
    <text class="ink title" data-type="title" x="120" y="137">冷凍庫の増設で供給増 — 卸値は下がり取扱量は増える</text>
    <text class="muted subtitle" data-type="subtitle" x="120" y="181">需要が変わらないと仮定したとき、供給曲線の右シフトが均衡をどう動かすか</text>
    <line class="rule" x1="120" y1="218" x2="1800" y2="218" stroke-width="2"/>

    <g aria-label="供給・需要の均衡図">
      <!-- Plot grid and axes -->
      <g class="rule" stroke-width="1">
        <line x1="350" y1="592" x2="1400" y2="592" stroke-dasharray="6 8"/>
        <line x1="350" y1="480" x2="1400" y2="480" stroke-dasharray="6 8"/>
        <line x1="600" y1="300" x2="600" y2="800" stroke-dasharray="4 10"/>
        <line x1="850" y1="300" x2="850" y2="800" stroke-dasharray="4 10"/>
        <line x1="1100" y1="300" x2="1100" y2="800" stroke-dasharray="4 10"/>
        <line x1="1350" y1="300" x2="1350" y2="800" stroke-dasharray="4 10"/>
      </g>
      <line x1="350" y1="300" x2="350" y2="800" stroke="var(--ink)" stroke-width="3"/>
      <line x1="350" y1="800" x2="1400" y2="800" stroke="var(--ink)" stroke-width="3"/>
      <text class="ink axis-title" data-type="axisTitle" x="350" y="270">卸売単価(円 / 箱)</text>
      <text class="ink axis-title" x="1400" y="852" text-anchor="end">1日あたり取扱量(箱)</text>
      <g class="muted tick">
        <text x="325" y="710" text-anchor="end" data-type="tick">600</text>
        <text x="325" y="598" text-anchor="end">800</text>
        <text x="325" y="486" text-anchor="end">1,000</text>
        <text x="325" y="374" text-anchor="end">1,200</text>
        <text x="350" y="836" text-anchor="middle">0</text>
        <text x="600" y="836" text-anchor="middle">40</text>
        <text x="850" y="836" text-anchor="middle">80</text>
        <text x="1100" y="836" text-anchor="middle">120</text>
        <text x="1350" y="836" text-anchor="middle">160</text>
      </g>

      <!-- Demand stays fixed; capacity expands supply from S0 to S1. -->
      <g clip-path="url(#plot-area-clip)">
        <path d="M350 315 L1400 700" fill="none" stroke="var(--ink)" stroke-width="5" stroke-linecap="round"/>
        <path d="M350 760 L1370 110" fill="none" stroke="var(--series-1)" stroke-width="5" stroke-linecap="round"/>
        <path d="M440 800 L1450 480" fill="none" stroke="var(--series-2)" stroke-width="7" stroke-linecap="round"/>
      </g>
      <text class="ink curve-label" data-type="curveLabel" x="1260" y="664">需要 D</text>
      <text fill="var(--series-1)" class="curve-label" x="1120" y="340">供給 S₀</text>
      <text fill="var(--series-2)" class="curve-label" x="1240" y="520">供給 S₁</text>
      <text class="muted tick" x="1120" y="369">増設前</text>
      <text class="muted tick" x="1240" y="548">冷凍庫の稼働後</text>

      <!-- Equilibria and projections -->
      <g stroke-width="2" fill="none">
        <path d="M790 479 V800 M350 479 H790" stroke="var(--series-1)" stroke-dasharray="8 8" opacity=".65"/>
        <path d="M1100 592 V800 M350 592 H1100" stroke="var(--series-2)" stroke-dasharray="8 8" opacity=".65"/>
      </g>
      <circle cx="790" cy="479" r="13" fill="var(--surface)" stroke="var(--series-1)" stroke-width="6"/>
      <circle cx="1100" cy="592" r="15" fill="var(--series-2)" stroke="var(--surface)" stroke-width="5"/>
      <rect x="650" y="406" width="118" height="42" rx="8" fill="var(--surface)" stroke="var(--series-1)" stroke-width="2"/>
      <text class="point-label" x="709" y="434" text-anchor="middle" fill="var(--series-1)" data-type="pointLabel">均衡 E₀</text>
      <rect x="1118" y="610" width="118" height="42" rx="8" fill="var(--surface)" stroke="var(--series-2)" stroke-width="2"/>
      <text class="point-label" x="1177" y="638" text-anchor="middle" fill="var(--series-2)">均衡 E₁</text>
    </g>

    <!-- Read the two equilibrium coordinates alongside the model. -->
    <g>
      <rect class="surface" x="1480" y="320" width="320" height="190" rx="18" stroke="var(--rule)" stroke-width="2"/>
      <rect x="1480" y="320" width="8" height="190" rx="4" fill="var(--series-1)"/>
      <text class="muted card-label" data-type="cardLabel" x="1510" y="363">増設前 · E₀</text>
      <text class="ink metric" data-type="metric" x="1510" y="411">70 箱 / 日</text>
      <text class="ink metric" x="1510" y="455">¥1,000 / 箱</text>
      <text class="muted card-label" x="1510" y="486">供給曲線 S₀</text>

      <rect class="surface" x="1480" y="540" width="320" height="190" rx="18" stroke="var(--series-2)" stroke-width="2"/>
      <rect x="1480" y="540" width="8" height="190" rx="4" fill="var(--series-2)"/>
      <text class="muted card-label" x="1510" y="583">稼働後 · E₁</text>
      <text class="ink metric" x="1510" y="631">120 箱 / 日</text>
      <text class="ink metric" x="1510" y="675">¥800 / 箱</text>
      <text class="muted card-label" x="1510" y="706">供給曲線 S₁</text>
    </g>

    <line class="rule" x1="120" y1="890" x2="1800" y2="890" stroke-width="2"/>
    <text class="ink finding" data-type="finding" x="120" y="938">モデル上の変化</text>
    <text class="ink" x="350" y="938" font-size="22">均衡量 +50 箱 / 日</text>
    <text class="ink" x="670" y="938" font-size="22">均衡価格 −¥200 / 箱</text>
    <g class="legend" data-type="legend">
      <line x1="1110" y1="930" x2="1150" y2="930" stroke="var(--ink)" stroke-width="5"/>
      <text class="muted" x="1164" y="937">需要 D</text>
      <line x1="1270" y1="930" x2="1310" y2="930" stroke="var(--series-1)" stroke-width="5"/>
      <text class="muted" x="1324" y="937">供給 S₀</text>
      <line x1="1480" y1="930" x2="1520" y2="930" stroke="var(--series-2)" stroke-width="7"/>
      <text class="muted" x="1534" y="937">供給 S₁</text>
    </g>
    <line class="rule" x1="120" y1="978" x2="1800" y2="978"/>
    <text class="muted note" data-type="note" x="120" y="1020">概念モデルの架空値。需要・費用など他の条件を固定した説明で、実市場の価格予測ではない。</text>
  </g>
</svg>
/designs/supply-shift-wholesale-equilibrium/font.css — 全部入りには入れていない
/* dv-subset v2 — generated by scripts/subset-font.mjs. Do not edit.
 * font    Zen Kaku Gothic New 400;500;700
 * chars   113 (3192f457d0cc3b48)
 *
 * pattern.html の文字だけを含む部分集合。描画時に外部へ取りに行かないよう同梱する。
 * 版の文字を変えたら取り直すこと — 忘れると足りない字が豆腐になる。
 * その取り忘れは pattern-entries.test.ts が上の指紋で検出する。
 */

@font-face {
  font-family: 'Zen Kaku Gothic New';
  font-style: normal;
  font-weight: 400;
  font-display: block;
  src: url(./font-0.woff2) format('woff2');
  unicode-range: U+2b-2c, U+2f-32, U+34-38, U+44-45, U+53, U+a5, U+b7, U+2014, U+2080-2081, U+2212, U+3001-3002, U+3042, U+3044, U+3046, U+3048, U+304b-304e, U+3057-305a, U+305f-3060, U+3066-306b, U+306e-3070, U+3078-3079, U+3088-308b, U+308f, U+3092, U+3094, U+3099, U+30b7-30b8, U+30c6-30c9, U+30d5-30d6, U+30e2, U+30eb, U+30fb, U+4e0a-4e0b, U+4e88, U+4ed6, U+4eee, U+4ef6, U+4f9b, U+4fa1, U+5024, U+50cd, U+5186, U+51b7, U+51cd, U+524d, U+52a0, U+52d5, U+5316, U+5358, U+5378, U+53d6, U+53f3, U+56f3, U+56fa, U+5747, U+5834, U+5897, U+58f2, U+5909, U+5b9a, U+5b9f, U+5e02, U+5eab, U+5f8c, U+5ff5, U+6271, U+65e5, U+660e, U+66f2, U+6761, U+67b6, U+683c, U+6982, U+6e2c, U+7528, U+79fb, U+7a3c, U+7a7a, U+7bb1, U+7d66, U+7dda, U+8861, U+8981, U+8a2d, U+8aac, U+8cbb, U+91cf, U+9700, U+ff08-ff09;
}
@font-face {
  font-family: 'Zen Kaku Gothic New';
  font-style: normal;
  font-weight: 500;
  font-display: block;
  src: url(./font-1.woff2) format('woff2');
  unicode-range: U+2b-2c, U+2f-32, U+34-38, U+44-45, U+53, U+a5, U+b7, U+2014, U+2080-2081, U+2212, U+3001-3002, U+3042, U+3044, U+3046, U+3048, U+304b-304e, U+3057-305a, U+305f-3060, U+3066-306b, U+306e-3070, U+3078-3079, U+3088-308b, U+308f, U+3092, U+3094, U+3099, U+30b7-30b8, U+30c6-30c9, U+30d5-30d6, U+30e2, U+30eb, U+30fb, U+4e0a-4e0b, U+4e88, U+4ed6, U+4eee, U+4ef6, U+4f9b, U+4fa1, U+5024, U+50cd, U+5186, U+51b7, U+51cd, U+524d, U+52a0, U+52d5, U+5316, U+5358, U+5378, U+53d6, U+53f3, U+56f3, U+56fa, U+5747, U+5834, U+5897, U+58f2, U+5909, U+5b9a, U+5b9f, U+5e02, U+5eab, U+5f8c, U+5ff5, U+6271, U+65e5, U+660e, U+66f2, U+6761, U+67b6, U+683c, U+6982, U+6e2c, U+7528, U+79fb, U+7a3c, U+7a7a, U+7bb1, U+7d66, U+7dda, U+8861, U+8981, U+8a2d, U+8aac, U+8cbb, U+91cf, U+9700, U+ff08-ff09;
}
@font-face {
  font-family: 'Zen Kaku Gothic New';
  font-style: normal;
  font-weight: 700;
  font-display: block;
  src: url(./font-2.woff2) format('woff2');
  unicode-range: U+2b-2c, U+2f-32, U+34-38, U+44-45, U+53, U+a5, U+b7, U+2014, U+2080-2081, U+2212, U+3001-3002, U+3042, U+3044, U+3046, U+3048, U+304b-304e, U+3057-305a, U+305f-3060, U+3066-306b, U+306e-3070, U+3078-3079, U+3088-308b, U+308f, U+3092, U+3094, U+3099, U+30b7-30b8, U+30c6-30c9, U+30d5-30d6, U+30e2, U+30eb, U+30fb, U+4e0a-4e0b, U+4e88, U+4ed6, U+4eee, U+4ef6, U+4f9b, U+4fa1, U+5024, U+50cd, U+5186, U+51b7, U+51cd, U+524d, U+52a0, U+52d5, U+5316, U+5358, U+5378, U+53d6, U+53f3, U+56f3, U+56fa, U+5747, U+5834, U+5897, U+58f2, U+5909, U+5b9a, U+5b9f, U+5e02, U+5eab, U+5f8c, U+5ff5, U+6271, U+65e5, U+660e, U+66f2, U+6761, U+67b6, U+683c, U+6982, U+6e2c, U+7528, U+79fb, U+7a3c, U+7a7a, U+7bb1, U+7d66, U+7dda, U+8861, U+8981, U+8a2d, U+8aac, U+8cbb, U+91cf, U+9700, U+ff08-ff09;
}
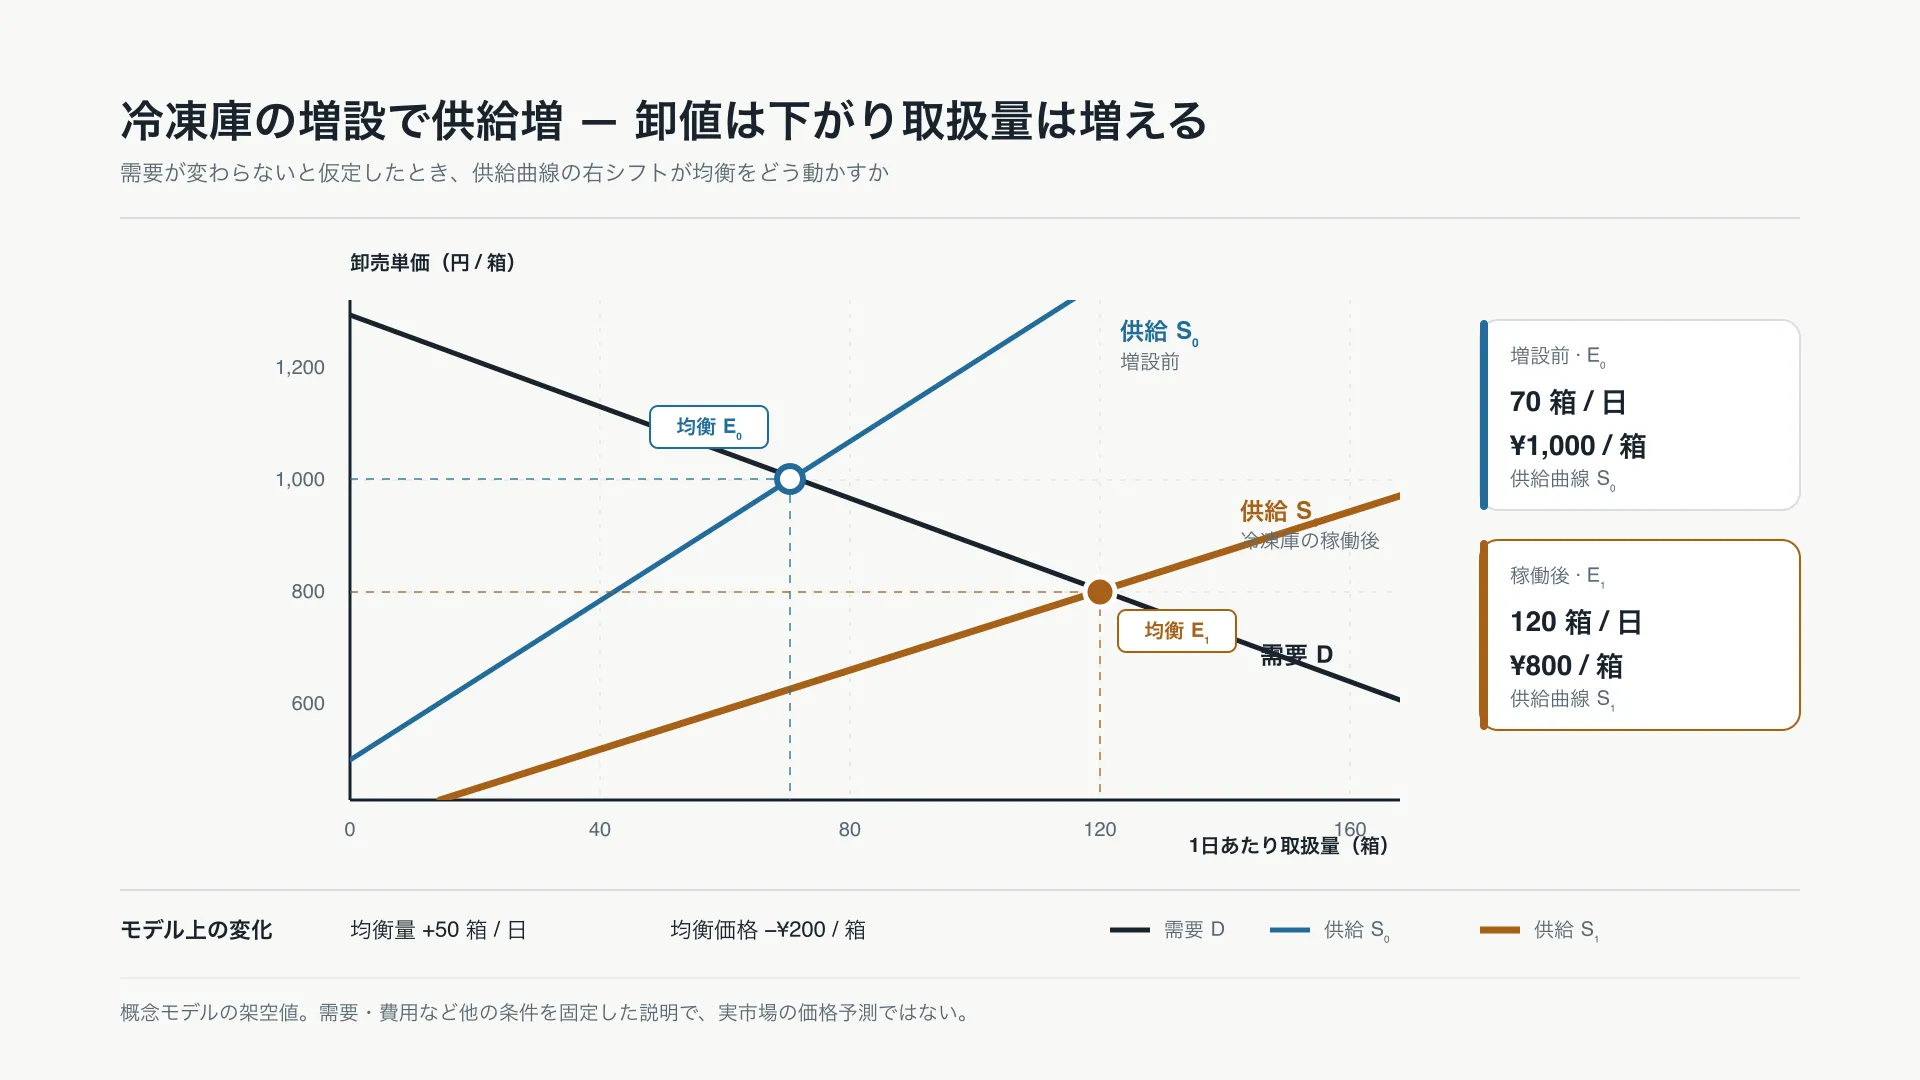
需要が一定の市場で冷凍庫を増設し、供給量が増えたら、均衡価格と取扱量はどう動くか。
横軸は1日あたり取扱量、縦軸は箱あたり卸売単価。黒い需要曲線Dは動かさず、供給曲線を増設前のS₀から稼働後のS₁へ右に移す。交点はE₀からE₁へ移り、モデル上の均衡量は70箱から120箱へ増え、均衡価格は1,000円から800円へ下がる。
この形は「他の条件が同じなら供給増が均衡価格を押し下げる」という比較静学の説明に使う。曲線の傾きや交点は計測した市場推定ではなく、需要が一定という条件も実市場では崩れうる。実際の価格予測には、期間・商品定義・費用・需要変化を揃えたデータが別途必要になる。