As measured
1920 × 1080 Seen as a design The artboard itself, drawn live — sharp at any zoom Structure, margins and columns overlaid
1920 × 1080 Seen as a design The artboard itself, drawn live — sharp at any zoom Structure, margins and columns overlaid
Copy and paste, or save a file and hand it over. For a machine with no network, one “Everything” file is enough.
Everything in this panel, including the contents behind each URL, in one Markdown file — Large, so it goes as a file (copy is for 32 KB and under)
Produce one slide to the following specification.

- Canvas 1920 × 1080
- Margin top 90 right 120 bottom 40 left 120

## Type (px against a 1920px canvas)
title  44px / 700 / tracking 0.01em
subtitle  22px / 400
axisTitle  20px / 700
tick  20px / 400
curveLabel  24px / 700
pointLabel  20px / 700
cardLabel  20px / 500
metric  28px / 700
finding  22px / 700
legend  20px / 500
note  20px / 400

## Colour
Ground #F7F8F5 / Surface #FFFFFF / Ink #18232D / Muted #586875 / Accent #C64E32 / Rule #D7DEE1 / #236B9A / #A66019

## Constraints — dropping these breaks it
- Hold demand D fixed and shift supply from S₀ to the right at S₁, then compare the equilibrium points.
- Project each equilibrium to the price and quantity axes to read the unit price and daily volume together.
- This conceptual model holds demand and other conditions such as costs constant; curve slopes are not empirical measurements.
- Fictional values are for explanation and should not be used for real-market price forecasts or investment decisions.

Replace the content with [your content]. Keep the measurements and colours as given.
For an exact reproduction, use the verbatim HTML at https://design-vault.pages.dev/designs/supply-shift-wholesale-equilibrium/pattern.html.
/ai/designs/supply-shift-wholesale-equilibrium.json
format: slide-16x9
density: medium
layout:
  kind: axis
  canvas:
    w: 1920
    h: 1080
  margin:
    top: 90
    right: 120
    bottom: 40
    left: 120
type:
  title:
    size: 44
    weight: 700
    tracking: 0.01em
  subtitle:
    size: 22
    weight: 400
  axisTitle:
    size: 20
    weight: 700
  tick:
    size: 20
    weight: 400
  curveLabel:
    size: 24
    weight: 700
  pointLabel:
    size: 20
    weight: 700
  cardLabel:
    size: 20
    weight: 500
  metric:
    size: 28
    weight: 700
  finding:
    size: 22
    weight: 700
  legend:
    size: 20
    weight: 500
  note:
    size: 20
    weight: 400
colors:
  ground: "#F7F8F5"
  surface: "#FFFFFF"
  ink: "#18232D"
  muted: "#586875"
  accent: "#C64E32"
  rule: "#D7DEE1"
  series:
    - "#236B9A"
    - "#A66019"
rules:
  - Hold demand D fixed and shift supply from S₀ to the right at S₁, then compare the equilibrium points.
  - Project each equilibrium to the price and quantity axes to read the unit price and daily volume together.
  - This conceptual model holds demand and other conditions such as costs constant; curve slopes are not empirical measurements.
  - Fictional values are for explanation and should not be used for real-market price forecasts or investment decisions.
{
"format": "slide-16x9",
"density": "medium",
"layout": {
"kind": "axis",
"canvas": {
"w": 1920,
"h": 1080
},
"margin": {
"top": 90,
"right": 120,
"bottom": 40,
"left": 120
}
},
"type": {
"title": {
"size": 44,
"weight": 700,
"tracking": "0.01em"
},
"subtitle": {
"size": 22,
"weight": 400
},
"axisTitle": {
"size": 20,
"weight": 700
},
"tick": {
"size": 20,
"weight": 400
},
"curveLabel": {
"size": 24,
"weight": 700
},
"pointLabel": {
"size": 20,
"weight": 700
},
"cardLabel": {
"size": 20,
"weight": 500
},
"metric": {
"size": 28,
"weight": 700
},
"finding": {
"size": 22,
"weight": 700
},
"legend": {
"size": 20,
"weight": 500
},
"note": {
"size": 20,
"weight": 400
}
},
"colors": {
"ground": "#F7F8F5",
"surface": "#FFFFFF",
"ink": "#18232D",
"muted": "#586875",
"accent": "#C64E32",
"rule": "#D7DEE1",
"series": [
"#236B9A",
"#A66019"
]
},
"rules": [
"Hold demand D fixed and shift supply from S₀ to the right at S₁, then compare the equilibrium points.",
"Project each equilibrium to the price and quantity axes to read the unit price and daily volume together.",
"This conceptual model holds demand and other conditions such as costs constant; curve slopes are not empirical measurements.",
"Fictional values are for explanation and should not be used for real-market price forecasts or investment decisions."
]
} /designs/supply-shift-wholesale-equilibrium/pattern.html — The artboard itself, font subset included — open it and this picture draws.
<!doctype html>
<meta charset="utf-8">
<title>冷凍庫の増設で供給増 — 卸値は下がり取扱量は増える</title>
<meta name="dv-font" content="Zen Kaku Gothic New:400;500;700">
<link rel="stylesheet" href="./font.css">
<style>
  :root {
    --ground: #F7F8F5;
    --surface: #FFFFFF;
    --ink: #18232D;
    --muted: #586875;
    --accent: #C64E32;
    --rule: #D7DEE1;
    --series-1: #236B9A;
    --series-2: #A66019;
  }
  * { box-sizing: border-box; margin: 0; }
  html, body { width: 1920px; height: 1080px; }
  body { font-family: "Zen Kaku Gothic New", "IPAGothic", sans-serif; }
</style>
<svg xmlns="http://www.w3.org/2000/svg" width="1920" height="1080" viewBox="0 0 1920 1080" role="img" aria-labelledby="market-title market-desc" data-artboard="true">
  <title id="market-title">供給の増加による卸売市場の均衡変化</title>
  <desc id="market-desc">需要曲線は変わらず、供給曲線が右へ移動する概念図。均衡取扱量は1日70箱から120箱へ増え、価格は1箱1000円から800円へ下がる。</desc>
  <style>
    text { font-family: "Zen Kaku Gothic New", "IPAGothic", sans-serif; }
    .ground { fill: var(--ground); }
    .surface { fill: var(--surface); }
    .ink { fill: var(--ink); }
    .muted { fill: var(--muted); }
    .rule { stroke: var(--rule); }
    .title { font-size: 44px; font-weight: 700; letter-spacing: .01em; }
    .subtitle { font-size: 22px; font-weight: 400; }
    .axis-title { font-size: 20px; font-weight: 700; }
    .tick { font-size: 20px; font-weight: 400; }
    .curve-label { font-size: 24px; font-weight: 700; }
    .point-label { font-size: 20px; font-weight: 700; }
    .card-label { font-size: 20px; font-weight: 500; }
    .metric { font-size: 28px; font-weight: 700; }
    .finding { font-size: 22px; font-weight: 700; }
    .legend { font-size: 20px; font-weight: 500; }
    .note { font-size: 20px; font-weight: 400; }
  </style>
  <defs><clipPath id="plot-area-clip"><rect x="350" y="300" width="1050" height="500"/></clipPath></defs>
  <rect class="ground" width="1920" height="1080"/>
  <g data-content="true">
    <rect x="120" y="90" width="1680" height="950" fill="none" aria-hidden="true"/>
    <text class="ink title" data-type="title" x="120" y="137">冷凍庫の増設で供給増 — 卸値は下がり取扱量は増える</text>
    <text class="muted subtitle" data-type="subtitle" x="120" y="181">需要が変わらないと仮定したとき、供給曲線の右シフトが均衡をどう動かすか</text>
    <line class="rule" x1="120" y1="218" x2="1800" y2="218" stroke-width="2"/>

    <g aria-label="供給・需要の均衡図">
      <!-- Plot grid and axes -->
      <g class="rule" stroke-width="1">
        <line x1="350" y1="592" x2="1400" y2="592" stroke-dasharray="6 8"/>
        <line x1="350" y1="480" x2="1400" y2="480" stroke-dasharray="6 8"/>
        <line x1="600" y1="300" x2="600" y2="800" stroke-dasharray="4 10"/>
        <line x1="850" y1="300" x2="850" y2="800" stroke-dasharray="4 10"/>
        <line x1="1100" y1="300" x2="1100" y2="800" stroke-dasharray="4 10"/>
        <line x1="1350" y1="300" x2="1350" y2="800" stroke-dasharray="4 10"/>
      </g>
      <line x1="350" y1="300" x2="350" y2="800" stroke="var(--ink)" stroke-width="3"/>
      <line x1="350" y1="800" x2="1400" y2="800" stroke="var(--ink)" stroke-width="3"/>
      <text class="ink axis-title" data-type="axisTitle" x="350" y="270">卸売単価(円 / 箱)</text>
      <text class="ink axis-title" x="1400" y="852" text-anchor="end">1日あたり取扱量(箱)</text>
      <g class="muted tick">
        <text x="325" y="710" text-anchor="end" data-type="tick">600</text>
        <text x="325" y="598" text-anchor="end">800</text>
        <text x="325" y="486" text-anchor="end">1,000</text>
        <text x="325" y="374" text-anchor="end">1,200</text>
        <text x="350" y="836" text-anchor="middle">0</text>
        <text x="600" y="836" text-anchor="middle">40</text>
        <text x="850" y="836" text-anchor="middle">80</text>
        <text x="1100" y="836" text-anchor="middle">120</text>
        <text x="1350" y="836" text-anchor="middle">160</text>
      </g>

      <!-- Demand stays fixed; capacity expands supply from S0 to S1. -->
      <g clip-path="url(#plot-area-clip)">
        <path d="M350 315 L1400 700" fill="none" stroke="var(--ink)" stroke-width="5" stroke-linecap="round"/>
        <path d="M350 760 L1370 110" fill="none" stroke="var(--series-1)" stroke-width="5" stroke-linecap="round"/>
        <path d="M440 800 L1450 480" fill="none" stroke="var(--series-2)" stroke-width="7" stroke-linecap="round"/>
      </g>
      <text class="ink curve-label" data-type="curveLabel" x="1260" y="664">需要 D</text>
      <text fill="var(--series-1)" class="curve-label" x="1120" y="340">供給 S₀</text>
      <text fill="var(--series-2)" class="curve-label" x="1240" y="520">供給 S₁</text>
      <text class="muted tick" x="1120" y="369">増設前</text>
      <text class="muted tick" x="1240" y="548">冷凍庫の稼働後</text>

      <!-- Equilibria and projections -->
      <g stroke-width="2" fill="none">
        <path d="M790 479 V800 M350 479 H790" stroke="var(--series-1)" stroke-dasharray="8 8" opacity=".65"/>
        <path d="M1100 592 V800 M350 592 H1100" stroke="var(--series-2)" stroke-dasharray="8 8" opacity=".65"/>
      </g>
      <circle cx="790" cy="479" r="13" fill="var(--surface)" stroke="var(--series-1)" stroke-width="6"/>
      <circle cx="1100" cy="592" r="15" fill="var(--series-2)" stroke="var(--surface)" stroke-width="5"/>
      <rect x="650" y="406" width="118" height="42" rx="8" fill="var(--surface)" stroke="var(--series-1)" stroke-width="2"/>
      <text class="point-label" x="709" y="434" text-anchor="middle" fill="var(--series-1)" data-type="pointLabel">均衡 E₀</text>
      <rect x="1118" y="610" width="118" height="42" rx="8" fill="var(--surface)" stroke="var(--series-2)" stroke-width="2"/>
      <text class="point-label" x="1177" y="638" text-anchor="middle" fill="var(--series-2)">均衡 E₁</text>
    </g>

    <!-- Read the two equilibrium coordinates alongside the model. -->
    <g>
      <rect class="surface" x="1480" y="320" width="320" height="190" rx="18" stroke="var(--rule)" stroke-width="2"/>
      <rect x="1480" y="320" width="8" height="190" rx="4" fill="var(--series-1)"/>
      <text class="muted card-label" data-type="cardLabel" x="1510" y="363">増設前 · E₀</text>
      <text class="ink metric" data-type="metric" x="1510" y="411">70 箱 / 日</text>
      <text class="ink metric" x="1510" y="455">¥1,000 / 箱</text>
      <text class="muted card-label" x="1510" y="486">供給曲線 S₀</text>

      <rect class="surface" x="1480" y="540" width="320" height="190" rx="18" stroke="var(--series-2)" stroke-width="2"/>
      <rect x="1480" y="540" width="8" height="190" rx="4" fill="var(--series-2)"/>
      <text class="muted card-label" x="1510" y="583">稼働後 · E₁</text>
      <text class="ink metric" x="1510" y="631">120 箱 / 日</text>
      <text class="ink metric" x="1510" y="675">¥800 / 箱</text>
      <text class="muted card-label" x="1510" y="706">供給曲線 S₁</text>
    </g>

    <line class="rule" x1="120" y1="890" x2="1800" y2="890" stroke-width="2"/>
    <text class="ink finding" data-type="finding" x="120" y="938">モデル上の変化</text>
    <text class="ink" x="350" y="938" font-size="22">均衡量 +50 箱 / 日</text>
    <text class="ink" x="670" y="938" font-size="22">均衡価格 −¥200 / 箱</text>
    <g class="legend" data-type="legend">
      <line x1="1110" y1="930" x2="1150" y2="930" stroke="var(--ink)" stroke-width="5"/>
      <text class="muted" x="1164" y="937">需要 D</text>
      <line x1="1270" y1="930" x2="1310" y2="930" stroke="var(--series-1)" stroke-width="5"/>
      <text class="muted" x="1324" y="937">供給 S₀</text>
      <line x1="1480" y1="930" x2="1520" y2="930" stroke="var(--series-2)" stroke-width="7"/>
      <text class="muted" x="1534" y="937">供給 S₁</text>
    </g>
    <line class="rule" x1="120" y1="978" x2="1800" y2="978"/>
    <text class="muted note" data-type="note" x="120" y="1020">概念モデルの架空値。需要・費用など他の条件を固定した説明で、実市場の価格予測ではない。</text>
  </g>
</svg>
/designs/supply-shift-wholesale-equilibrium/font.css — Not in Everything
/* dv-subset v2 — generated by scripts/subset-font.mjs. Do not edit.
 * font    Zen Kaku Gothic New 400;500;700
 * chars   113 (3192f457d0cc3b48)
 *
 * pattern.html の文字だけを含む部分集合。描画時に外部へ取りに行かないよう同梱する。
 * 版の文字を変えたら取り直すこと — 忘れると足りない字が豆腐になる。
 * その取り忘れは pattern-entries.test.ts が上の指紋で検出する。
 */

@font-face {
  font-family: 'Zen Kaku Gothic New';
  font-style: normal;
  font-weight: 400;
  font-display: block;
  src: url(./font-0.woff2) format('woff2');
  unicode-range: U+2b-2c, U+2f-32, U+34-38, U+44-45, U+53, U+a5, U+b7, U+2014, U+2080-2081, U+2212, U+3001-3002, U+3042, U+3044, U+3046, U+3048, U+304b-304e, U+3057-305a, U+305f-3060, U+3066-306b, U+306e-3070, U+3078-3079, U+3088-308b, U+308f, U+3092, U+3094, U+3099, U+30b7-30b8, U+30c6-30c9, U+30d5-30d6, U+30e2, U+30eb, U+30fb, U+4e0a-4e0b, U+4e88, U+4ed6, U+4eee, U+4ef6, U+4f9b, U+4fa1, U+5024, U+50cd, U+5186, U+51b7, U+51cd, U+524d, U+52a0, U+52d5, U+5316, U+5358, U+5378, U+53d6, U+53f3, U+56f3, U+56fa, U+5747, U+5834, U+5897, U+58f2, U+5909, U+5b9a, U+5b9f, U+5e02, U+5eab, U+5f8c, U+5ff5, U+6271, U+65e5, U+660e, U+66f2, U+6761, U+67b6, U+683c, U+6982, U+6e2c, U+7528, U+79fb, U+7a3c, U+7a7a, U+7bb1, U+7d66, U+7dda, U+8861, U+8981, U+8a2d, U+8aac, U+8cbb, U+91cf, U+9700, U+ff08-ff09;
}
@font-face {
  font-family: 'Zen Kaku Gothic New';
  font-style: normal;
  font-weight: 500;
  font-display: block;
  src: url(./font-1.woff2) format('woff2');
  unicode-range: U+2b-2c, U+2f-32, U+34-38, U+44-45, U+53, U+a5, U+b7, U+2014, U+2080-2081, U+2212, U+3001-3002, U+3042, U+3044, U+3046, U+3048, U+304b-304e, U+3057-305a, U+305f-3060, U+3066-306b, U+306e-3070, U+3078-3079, U+3088-308b, U+308f, U+3092, U+3094, U+3099, U+30b7-30b8, U+30c6-30c9, U+30d5-30d6, U+30e2, U+30eb, U+30fb, U+4e0a-4e0b, U+4e88, U+4ed6, U+4eee, U+4ef6, U+4f9b, U+4fa1, U+5024, U+50cd, U+5186, U+51b7, U+51cd, U+524d, U+52a0, U+52d5, U+5316, U+5358, U+5378, U+53d6, U+53f3, U+56f3, U+56fa, U+5747, U+5834, U+5897, U+58f2, U+5909, U+5b9a, U+5b9f, U+5e02, U+5eab, U+5f8c, U+5ff5, U+6271, U+65e5, U+660e, U+66f2, U+6761, U+67b6, U+683c, U+6982, U+6e2c, U+7528, U+79fb, U+7a3c, U+7a7a, U+7bb1, U+7d66, U+7dda, U+8861, U+8981, U+8a2d, U+8aac, U+8cbb, U+91cf, U+9700, U+ff08-ff09;
}
@font-face {
  font-family: 'Zen Kaku Gothic New';
  font-style: normal;
  font-weight: 700;
  font-display: block;
  src: url(./font-2.woff2) format('woff2');
  unicode-range: U+2b-2c, U+2f-32, U+34-38, U+44-45, U+53, U+a5, U+b7, U+2014, U+2080-2081, U+2212, U+3001-3002, U+3042, U+3044, U+3046, U+3048, U+304b-304e, U+3057-305a, U+305f-3060, U+3066-306b, U+306e-3070, U+3078-3079, U+3088-308b, U+308f, U+3092, U+3094, U+3099, U+30b7-30b8, U+30c6-30c9, U+30d5-30d6, U+30e2, U+30eb, U+30fb, U+4e0a-4e0b, U+4e88, U+4ed6, U+4eee, U+4ef6, U+4f9b, U+4fa1, U+5024, U+50cd, U+5186, U+51b7, U+51cd, U+524d, U+52a0, U+52d5, U+5316, U+5358, U+5378, U+53d6, U+53f3, U+56f3, U+56fa, U+5747, U+5834, U+5897, U+58f2, U+5909, U+5b9a, U+5b9f, U+5e02, U+5eab, U+5f8c, U+5ff5, U+6271, U+65e5, U+660e, U+66f2, U+6761, U+67b6, U+683c, U+6982, U+6e2c, U+7528, U+79fb, U+7a3c, U+7a7a, U+7bb1, U+7d66, U+7dda, U+8861, U+8981, U+8a2d, U+8aac, U+8cbb, U+91cf, U+9700, U+ff08-ff09;
}
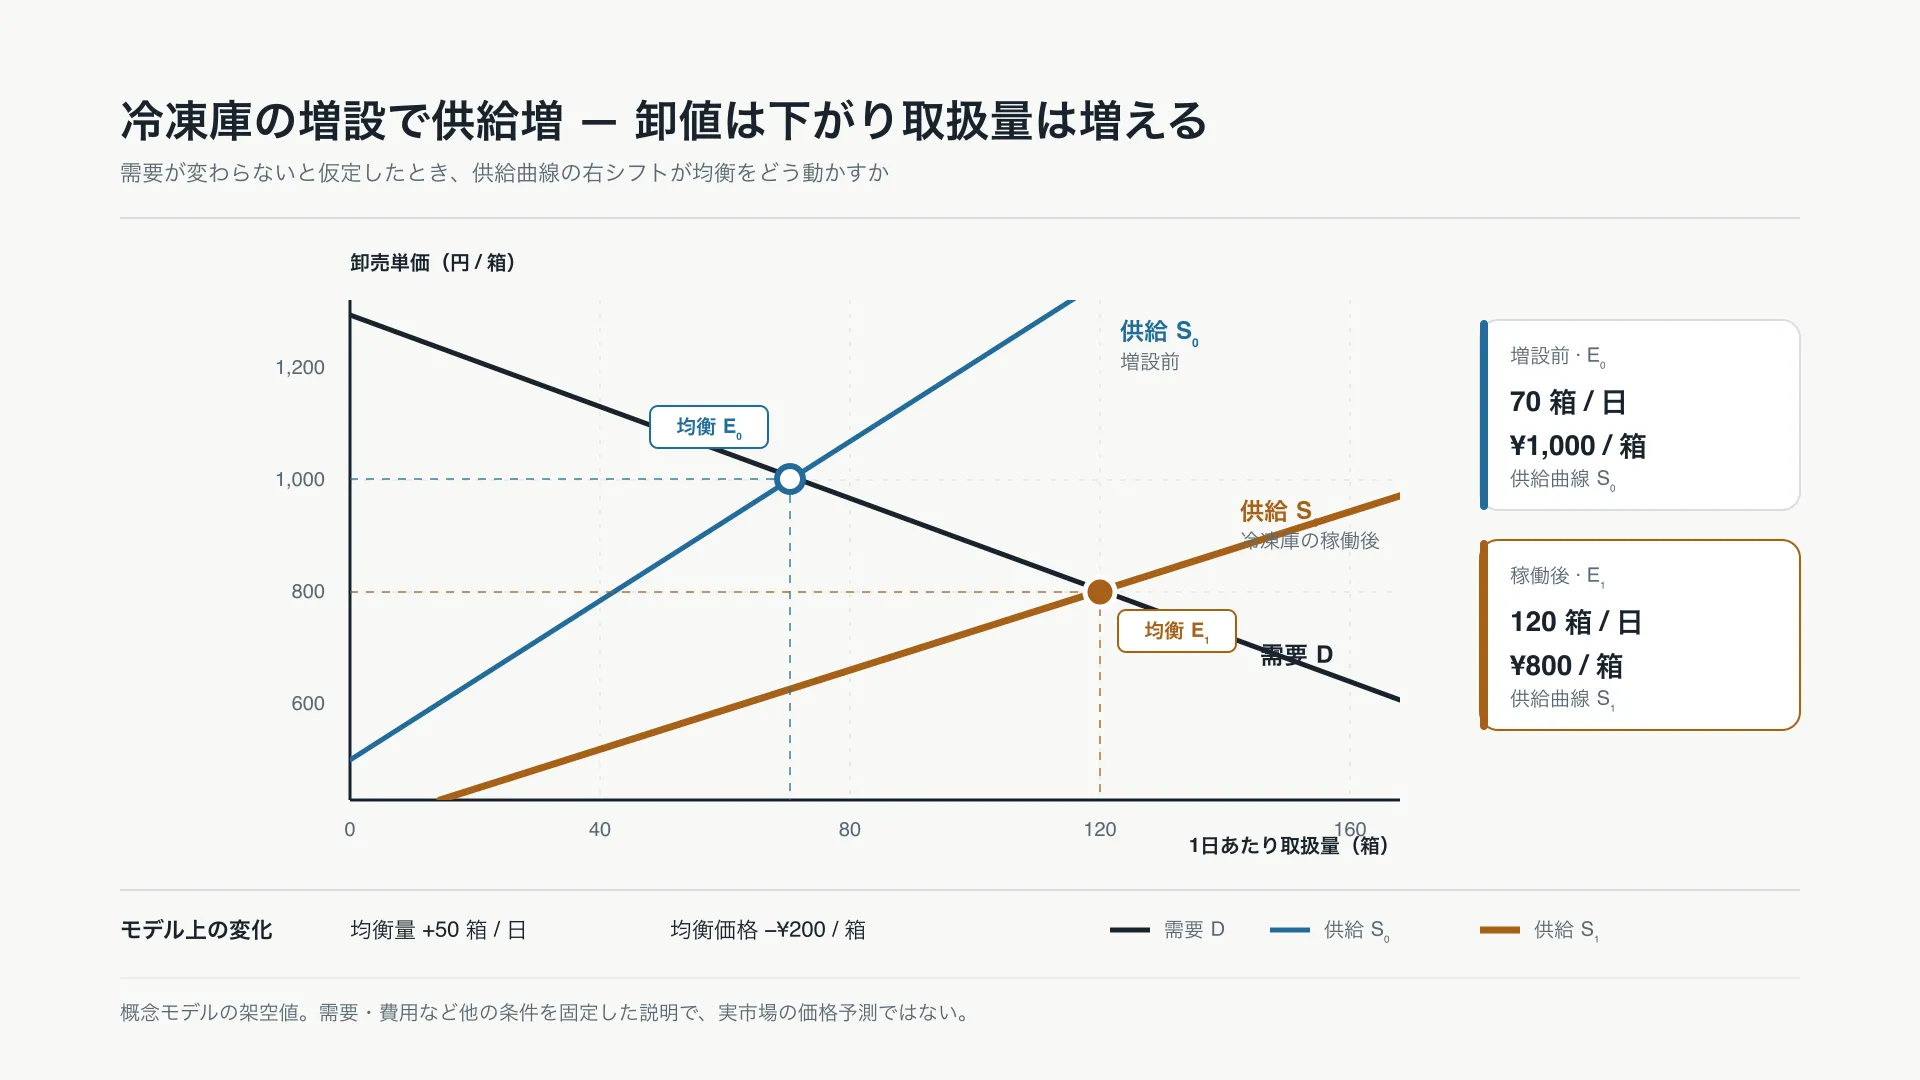
需要が一定の市場で冷凍庫を増設し、供給量が増えたら、均衡価格と取扱量はどう動くか。
横軸は1日あたり取扱量、縦軸は箱あたり卸売単価。黒い需要曲線Dは動かさず、供給曲線を増設前のS₀から稼働後のS₁へ右に移す。交点はE₀からE₁へ移り、モデル上の均衡量は70箱から120箱へ増え、均衡価格は1,000円から800円へ下がる。
この形は「他の条件が同じなら供給増が均衡価格を押し下げる」という比較静学の説明に使う。曲線の傾きや交点は計測した市場推定ではなく、需要が一定という条件も実市場では崩れうる。実際の価格予測には、期間・商品定義・費用・需要変化を揃えたデータが別途必要になる。