1920 × 1080 Seen as a design The artboard itself, drawn live — sharp at any zoom Structure, margins and columns overlaid
1920 × 1080 Seen as a design The artboard itself, drawn live — sharp at any zoom Structure, margins and columns overlaid
Copy and paste, or save a file and hand it over. For a machine with no network, one “Everything” file is enough.
Everything in this panel, including the contents behind each URL, in one Markdown file — Large, so it goes as a file (copy is for 32 KB and under)
Produce one slide to the following specification.

- Canvas 1920 × 1080
- Margin top 100 right 140 bottom 100 left 140

## Type (px against a 1920px canvas)
title  46px / 700 / tracking 0.01em
subtitle  22px / 500
axisTitle  22px / 700
tick  20px / 500
legend  20px / 500
takeaway  28px / 500
note  20px / 400

## Colour
Ground #FFFFFF / Surface #F4F6F9 / Ink #131820 / Muted #667183 / Accent #1F5FA8 / Rule #DBE1E9

## Constraints — dropping these breaks it
- Each candle represents one period's open, close, high, and low as a single unit.
- The body bounds are open and close; the wick ends are the period high and low.
- Color indicates whether close is above or below open; state the convention because it varies by market.
- Fictional data for ten trading days; do not infer future performance from this price history.

Replace the content with [your content]. Keep the measurements and colours as given.
For an exact reproduction, use the verbatim HTML at https://design-vault.pages.dev/designs/candlestick-chart-daily-price-range/pattern.html.
/ai/designs/candlestick-chart-daily-price-range.json
format: slide-16x9
density: medium
layout:
  kind: axis
  canvas:
    w: 1920
    h: 1080
  margin:
    top: 100
    right: 140
    bottom: 100
    left: 140
type:
  title:
    size: 46
    weight: 700
    tracking: 0.01em
  subtitle:
    size: 22
    weight: 500
  axisTitle:
    size: 22
    weight: 700
  tick:
    size: 20
    weight: 500
  legend:
    size: 20
    weight: 500
  takeaway:
    size: 28
    weight: 500
  note:
    size: 20
    weight: 400
colors:
  ground: "#FFFFFF"
  surface: "#F4F6F9"
  ink: "#131820"
  muted: "#667183"
  accent: "#1F5FA8"
  rule: "#DBE1E9"
rules:
  - Each candle represents one period's open, close, high, and low as a single unit.
  - The body bounds are open and close; the wick ends are the period high and low.
  - Color indicates whether close is above or below open; state the convention because it varies by market.
  - Fictional data for ten trading days; do not infer future performance from this price history.
{
"format": "slide-16x9",
"density": "medium",
"layout": {
"kind": "axis",
"canvas": {
"w": 1920,
"h": 1080
},
"margin": {
"top": 100,
"right": 140,
"bottom": 100,
"left": 140
}
},
"type": {
"title": {
"size": 46,
"weight": 700,
"tracking": "0.01em"
},
"subtitle": {
"size": 22,
"weight": 500
},
"axisTitle": {
"size": 22,
"weight": 700
},
"tick": {
"size": 20,
"weight": 500
},
"legend": {
"size": 20,
"weight": 500
},
"takeaway": {
"size": 28,
"weight": 500
},
"note": {
"size": 20,
"weight": 400
}
},
"colors": {
"ground": "#FFFFFF",
"surface": "#F4F6F9",
"ink": "#131820",
"muted": "#667183",
"accent": "#1F5FA8",
"rule": "#DBE1E9"
},
"rules": [
"Each candle represents one period's open, close, high, and low as a single unit.",
"The body bounds are open and close; the wick ends are the period high and low.",
"Color indicates whether close is above or below open; state the convention because it varies by market.",
"Fictional data for ten trading days; do not infer future performance from this price history."
]
} /designs/candlestick-chart-daily-price-range/pattern.html — The artboard itself, font subset included — open it and this picture draws.
<!doctype html>
<meta charset="utf-8">
<title>株価の10日推移 — 終値は8.5%上昇</title>
<meta name="dv-font" content="Zen Kaku Gothic New:400;500;700">
<link rel="stylesheet" href="./font.css">
<style>
:root{--ground:#FFFFFF;--surface:#F4F6F9;--ink:#131820;--muted:#667183;--accent:#1F5FA8;--rule:#DBE1E9;
  --plot-color-1: #C16A24;
}
*{box-sizing:border-box;margin:0}html,body{width:1920px;height:1080px}body{font-family:"Zen Kaku Gothic New","Hiragino Sans",sans-serif}
.artboard{width:1920px;height:1080px;padding:100px 140px;background:var(--ground);color:var(--ink)}.content{width:100%;height:100%;position:relative}.figure{position:absolute;left:-140px;top:-100px;width:1920px;height:1080px}
</style>
<div class="artboard" data-artboard><div class="content" data-content>
<svg class="figure" width="1920" height="1080" viewBox="0 0 1920 1080" xmlns="http://www.w3.org/2000/svg" role="img" aria-label="架空の10営業日の株価ローソク足。終値は2000円から2170円へ8.5%上昇。青い実体は始値より終値が高く、橙は終値が低い。上下のひげは日中高値と安値。">
<style>
.figure{font-family:"Zen Kaku Gothic New","Hiragino Sans",sans-serif}.ground{fill:var(--ground)}.ink{fill:var(--ink)}.muted{fill:var(--muted)}.rule{stroke:var(--rule)}
.title{font-size:46px;font-weight:700;letter-spacing:.01em}.subtitle{font-size:22px;font-weight:500}.axis-title{font-size:22px;font-weight:700}.tick{font-size:20px;font-weight:500}.legend{font-size:20px;font-weight:500}.takeaway{font-size:28px;font-weight:500}.note{font-size:20px;font-weight:400}
.up{fill:var(--accent);stroke:var(--accent)}.down{fill:var(--plot-color-1);stroke:var(--plot-color-1)}.wick{stroke-width:4}.body{stroke-width:2}
</style>
<rect class="ground" width="1920" height="1080"/>
<text class="ink title" data-type="title" x="140" y="153">株価の10日推移 — 終値は8.5%上昇</text>
<text class="muted subtitle" data-type="subtitle" x="140" y="201">架空の営業日データ / 各ローソクは始値・終値・日中高値・日中安値を表示</text>
<line class="rule" x1="140" y1="238" x2="1780" y2="238" stroke-width="2"/>
<text class="ink axis-title" data-type="axisTitle" x="960" y="294" text-anchor="middle">終値の方向と、各日の値動き幅を同時に読む</text>
<text class="muted legend" x="140" y="330">価格(円)</text>
<g class="rule" fill="none" stroke-width="1.5">
<line x1="400" y1="379" x2="1510" y2="379"/><line x1="400" y1="460" x2="1510" y2="460"/><line x1="400" y1="541" x2="1510" y2="541"/><line x1="400" y1="622" x2="1510" y2="622"/><line x1="400" y1="703" x2="1510" y2="703"/><line x1="400" y1="744" x2="1510" y2="744"/>
</g>
<g class="muted tick" text-anchor="end" dominant-baseline="central"><text data-type="tick" x="370" y="379">2,220</text><text x="370" y="460">2,160</text><text x="370" y="541">2,100</text><text x="370" y="622">2,040</text><text x="370" y="703">1,980</text><text x="370" y="744">1,950</text></g>
<!-- Scale: y=730-(price-1960)*1.35. Candle body spans close and open; wick spans low and high. -->
<g class="up"><line class="wick" x1="500" y1="622" x2="500" y2="703"/><rect class="body" x="482" y="663" width="36" height="14" rx="2"/></g>
<g class="down"><line class="wick" x1="610" y1="636" x2="610" y2="717"/><rect class="body" x="592" y="663" width="36" height="27" rx="2"/></g>
<g class="up"><line class="wick" x1="720" y1="616" x2="720" y2="703"/><rect class="body" x="702" y="649" width="36" height="41" rx="2"/></g>
<g class="up"><line class="wick" x1="830" y1="568" x2="830" y2="663"/><rect class="body" x="812" y="595" width="36" height="54" rx="2"/></g>
<g class="down"><line class="wick" x1="940" y1="575" x2="940" y2="636"/><rect class="body" x="922" y="595" width="36" height="14" rx="2"/></g>
<g class="up"><line class="wick" x1="1050" y1="528" x2="1050" y2="622"/><rect class="body" x="1032" y="555" width="36" height="54" rx="2"/></g>
<g class="up"><line class="wick" x1="1160" y1="487" x2="1160" y2="568"/><rect class="body" x="1142" y="528" width="36" height="27" rx="2"/></g>
<g class="down"><line class="wick" x1="1270" y1="514" x2="1270" y2="595"/><rect class="body" x="1252" y="528" width="36" height="41" rx="2"/></g>
<g class="up"><line class="wick" x1="1380" y1="460" x2="1380" y2="582"/><rect class="body" x="1362" y="487" width="36" height="81" rx="2"/></g>
<g class="up"><line class="wick" x1="1490" y1="406" x2="1490" y2="514"/><rect class="body" x="1472" y="446" width="36" height="68" rx="2"/></g>
<g class="muted tick" text-anchor="middle" dominant-baseline="central"><text data-type="tick" x="500" y="774">1日</text><text x="610" y="774">2日</text><text x="720" y="774">3日</text><text x="830" y="774">4日</text><text x="940" y="774">5日</text><text x="1050" y="774">6日</text><text x="1160" y="774">7日</text><text x="1270" y="774">8日</text><text x="1380" y="774">9日</text><text x="1490" y="774">10日</text></g>
<g dominant-baseline="central"><rect class="up" x="600" y="844" width="22" height="22" rx="3"/><text class="ink legend" data-type="legend" x="634" y="855">終値が始値より高い</text><rect class="down" x="1010" y="844" width="22" height="22" rx="3"/><text class="ink legend" x="1044" y="855">終値が始値より低い</text></g>
<text class="ink takeaway" data-type="takeaway" x="960" y="936" text-anchor="middle">終値は2,000円から2,170円へ — 10営業日で +8.5%</text>
<line class="rule" x1="140" y1="974" x2="1780" y2="974" stroke-width="1"/><text class="muted note" data-type="note" x="140" y="1013">ローソクの実体は始値と終値、ひげは当日の高値と安値。架空データであり投資判断には使わない。</text>
</svg></div></div>
/designs/candlestick-chart-daily-price-range/font.css — Not in Everything
/* dv-subset v2 — generated by scripts/subset-font.mjs. Do not edit.
 * font    Zen Kaku Gothic New 400;500;700
 * chars   85 (dec354bb45d6638c)
 *
 * pattern.html の文字だけを含む部分集合。描画時に外部へ取りに行かないよう同梱する。
 * 版の文字を変えたら取り直すこと — 忘れると足りない字が豆腐になる。
 * その取り忘れは pattern-entries.test.ts が上の指紋で検出する。
 */

@font-face {
  font-family: 'Zen Kaku Gothic New';
  font-style: normal;
  font-weight: 400;
  font-display: block;
  src: url(./font-0.woff2) format('woff2');
  unicode-range: U+25, U+2b-2c, U+2e-39, U+2014, U+3001-3002, U+3042, U+3044, U+304b-304e, U+3051-3052, U+3066-306b, U+306e-3070, U+3072-3073, U+3078-3079, U+3080, U+3088-308a, U+308f, U+3092, U+3099, U+30af-30b0, U+30bd-30c0, U+30c6-30c7, U+30ed, U+30fb-30fc, U+4e0a, U+4e2d, U+4f4e, U+4f53, U+4f7f, U+4fa1, U+5024, U+5186, U+5224, U+52d5, U+5404, U+540c, U+5411, U+55b6, U+59cb, U+5b89, U+5b9f, U+5e45, U+5f53, U+6295, U+63a8, U+65ad, U+65b9, U+65e5, U+6607, U+6642, U+67b6, U+682a, U+683c, U+696d, U+793a, U+79fb, U+7a7a, U+7d42, U+8868, U+8aad, U+8cc7, U+9ad8, U+ff08-ff09;
}
@font-face {
  font-family: 'Zen Kaku Gothic New';
  font-style: normal;
  font-weight: 500;
  font-display: block;
  src: url(./font-1.woff2) format('woff2');
  unicode-range: U+25, U+2b-2c, U+2e-39, U+2014, U+3001-3002, U+3042, U+3044, U+304b-304e, U+3051-3052, U+3066-306b, U+306e-3070, U+3072-3073, U+3078-3079, U+3080, U+3088-308a, U+308f, U+3092, U+3099, U+30af-30b0, U+30bd-30c0, U+30c6-30c7, U+30ed, U+30fb-30fc, U+4e0a, U+4e2d, U+4f4e, U+4f53, U+4f7f, U+4fa1, U+5024, U+5186, U+5224, U+52d5, U+5404, U+540c, U+5411, U+55b6, U+59cb, U+5b89, U+5b9f, U+5e45, U+5f53, U+6295, U+63a8, U+65ad, U+65b9, U+65e5, U+6607, U+6642, U+67b6, U+682a, U+683c, U+696d, U+793a, U+79fb, U+7a7a, U+7d42, U+8868, U+8aad, U+8cc7, U+9ad8, U+ff08-ff09;
}
@font-face {
  font-family: 'Zen Kaku Gothic New';
  font-style: normal;
  font-weight: 700;
  font-display: block;
  src: url(./font-2.woff2) format('woff2');
  unicode-range: U+25, U+2b-2c, U+2e-39, U+2014, U+3001-3002, U+3042, U+3044, U+304b-304e, U+3051-3052, U+3066-306b, U+306e-3070, U+3072-3073, U+3078-3079, U+3080, U+3088-308a, U+308f, U+3092, U+3099, U+30af-30b0, U+30bd-30c0, U+30c6-30c7, U+30ed, U+30fb-30fc, U+4e0a, U+4e2d, U+4f4e, U+4f53, U+4f7f, U+4fa1, U+5024, U+5186, U+5224, U+52d5, U+5404, U+540c, U+5411, U+55b6, U+59cb, U+5b89, U+5b9f, U+5e45, U+5f53, U+6295, U+63a8, U+65ad, U+65b9, U+65e5, U+6607, U+6642, U+67b6, U+682a, U+683c, U+696d, U+793a, U+79fb, U+7a7a, U+7d42, U+8868, U+8aad, U+8cc7, U+9ad8, U+ff08-ff09;
}
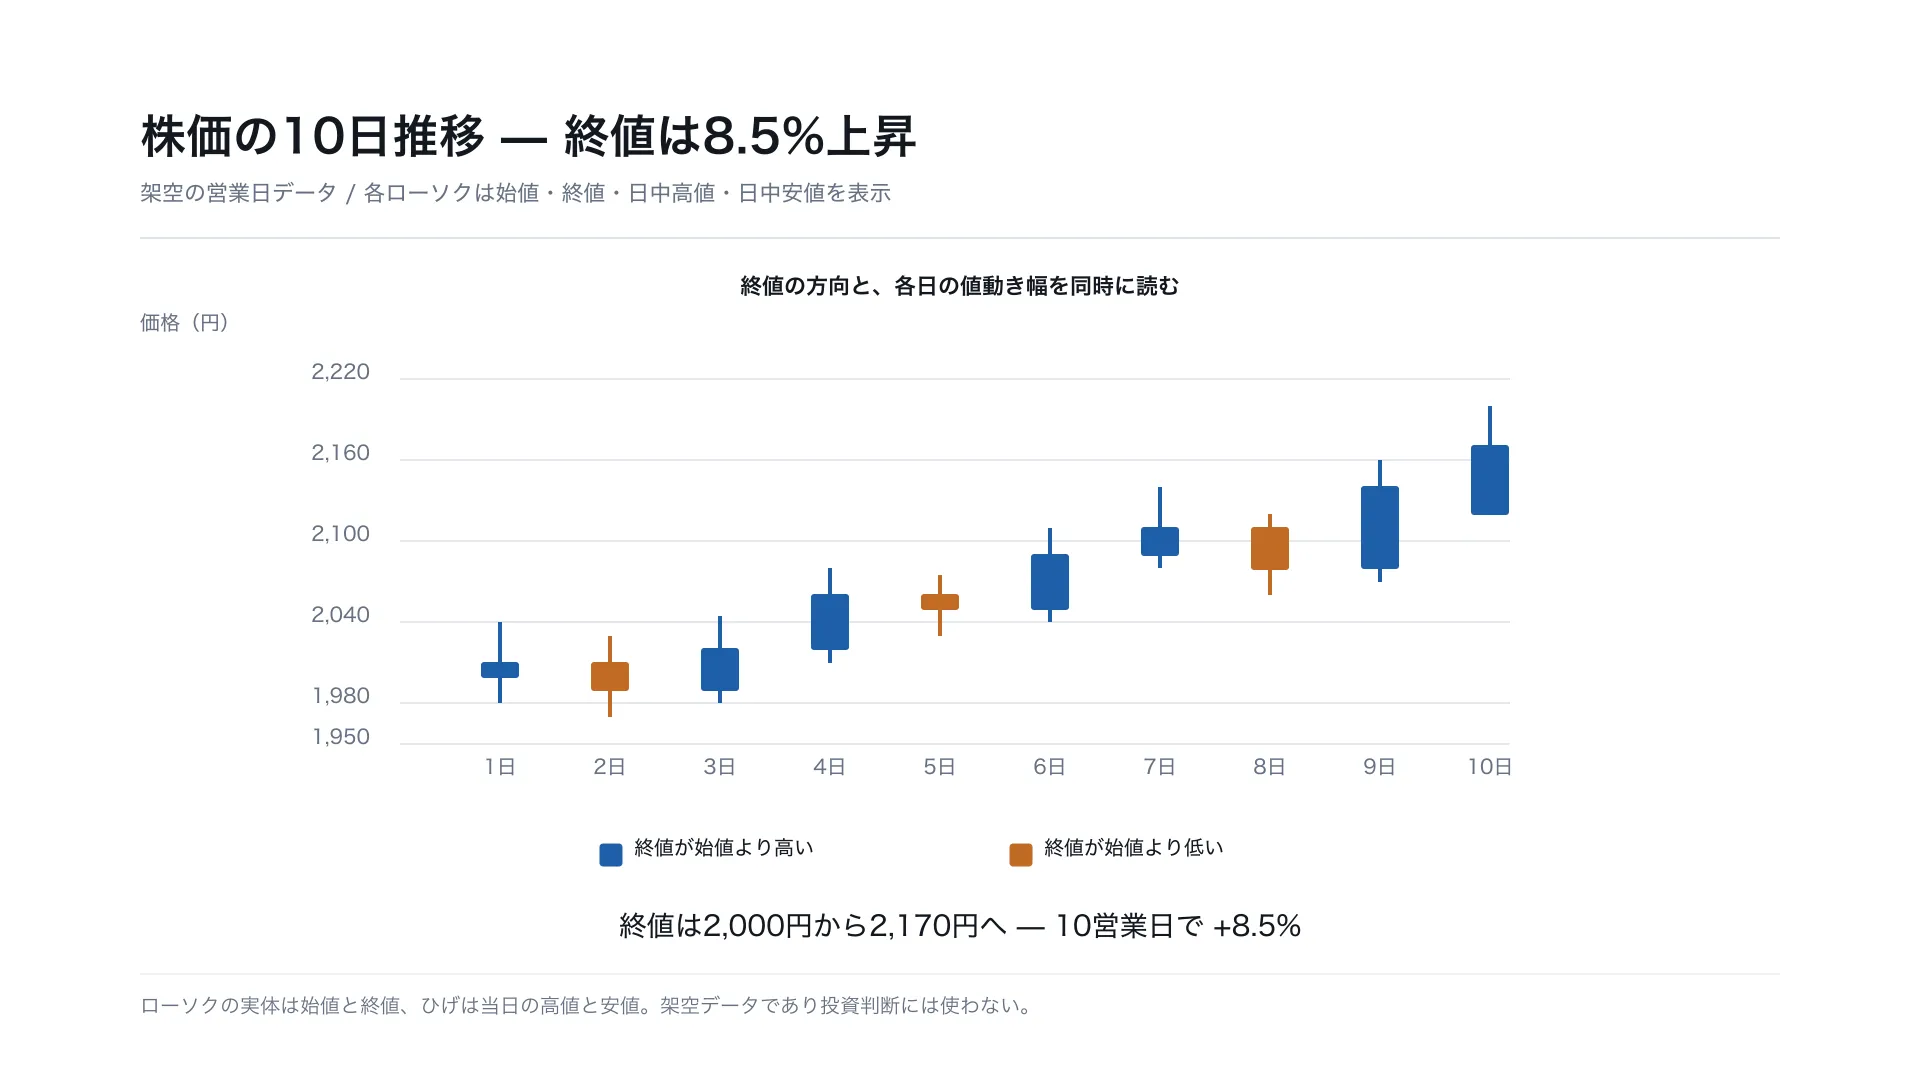
10営業日の間、終値はどちらへ動き、各日の値幅はどれほどだったか。
横軸は営業日、縦軸は価格。各ローソクの実体は始値と終値の間、上下のひげは日中高値と安値を結ぶ。 終値が始値より高い日は青、低い日は橙で示す。架空データの終値は2,000円から2,170円へ上昇し、 値幅や反転を含む日ごとの動きを一度に読める。
終値を線で結ぶ時系列グラフは主に終値の推移を示すが、ローソク足は各期間内の始値・高値・安値も符号化する。 したがって一日の上下動、終値の方向、値幅を区別して確認できる。色の上下慣例は市場ごとに異なるため凡例を付ける。