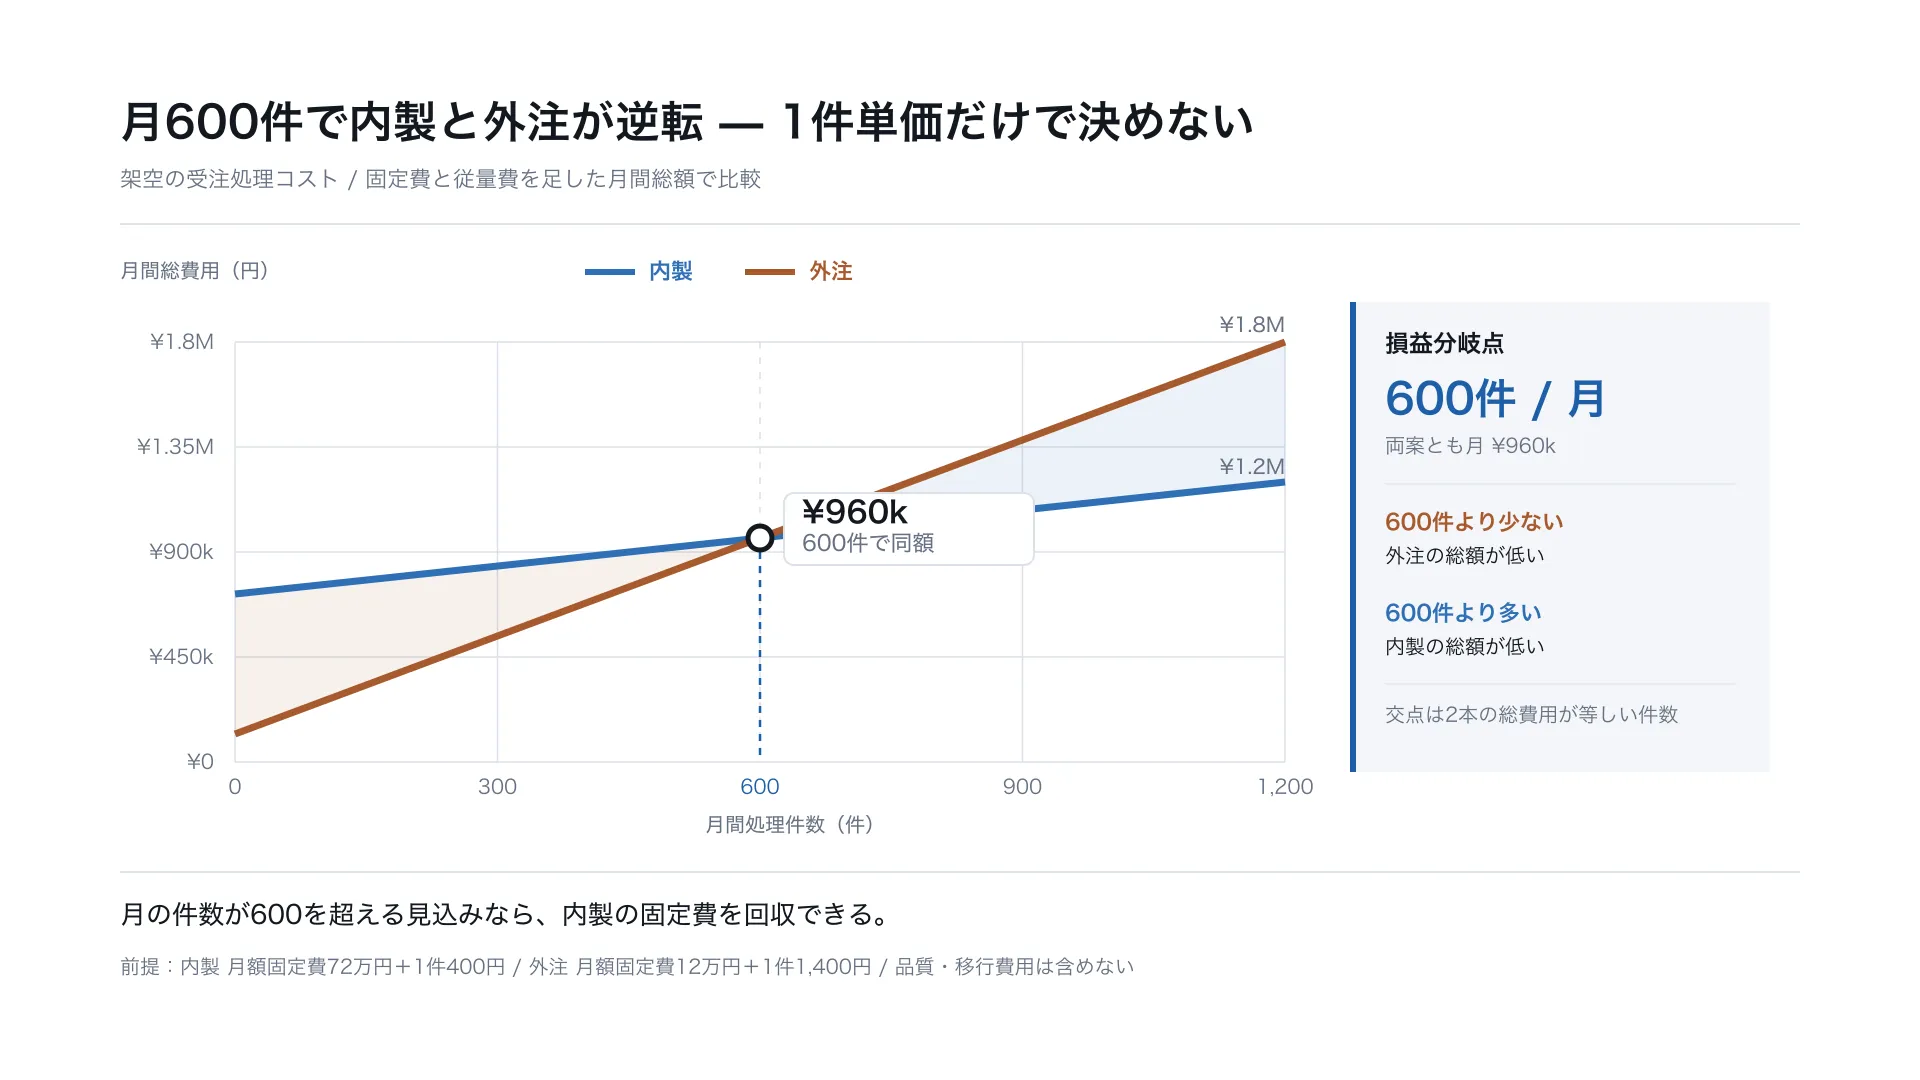
In-House and Outsourced Costs Cross at 600 Orders per Month
Layouts for real work
Canvas, margins, columns, type, role-keyed colour, and the constraints that break it if dropped. Every entry carries a spec you can reproduce from, so a layout you like does not stop at being looked at — hand it to an AI and get your own document back.
 Quarterly Roadmap — Four Equal Bands
  One-page Proposal Cover — Subject at the Center
 Filter by what you are making and by the skeleton. Three views: plate, skeleton, table.
Deck
Cover to appendix door, in reading order. A unit above the single entries of the index.
Not another image board
The plate is drawn from the artboard’s own HTML, so the picture and the numbers cannot disagree. What is filed here is measurements, not pictures.
Canvas size, the four margins, column count and gap — and which column or row is emphasized.
Size, weight, leading and tracking, keyed by the role each one plays: heading, body, caption.
ground / surface / ink / muted / accent / rule — so you can tell the floor from the accent.
The constraints that have to hold, written out: “emphasize one column only”, and the like.
Two kinds on one shelf
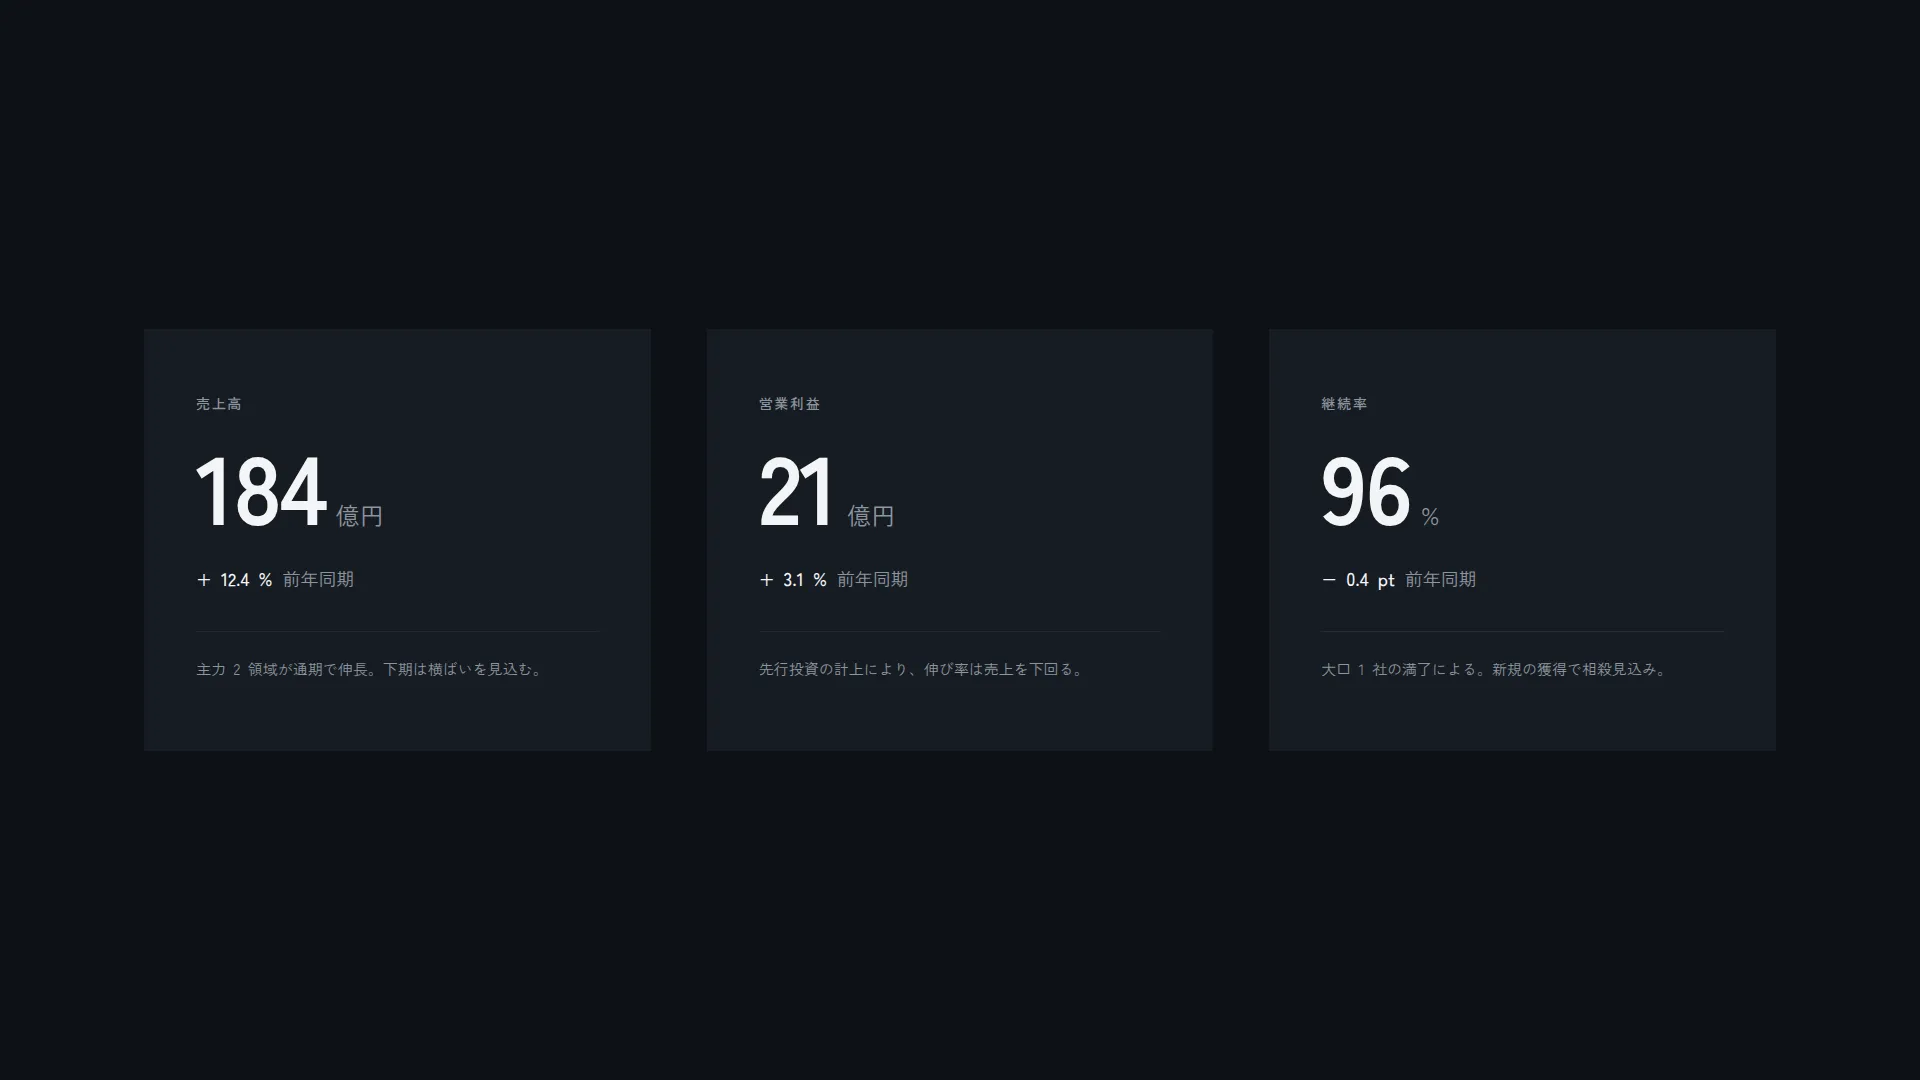
The artboard’s own HTML is served instead of a picture of it, so the type stays sharp at any zoom. The webfont subset travels with it, so opening one fetches nothing from outside.
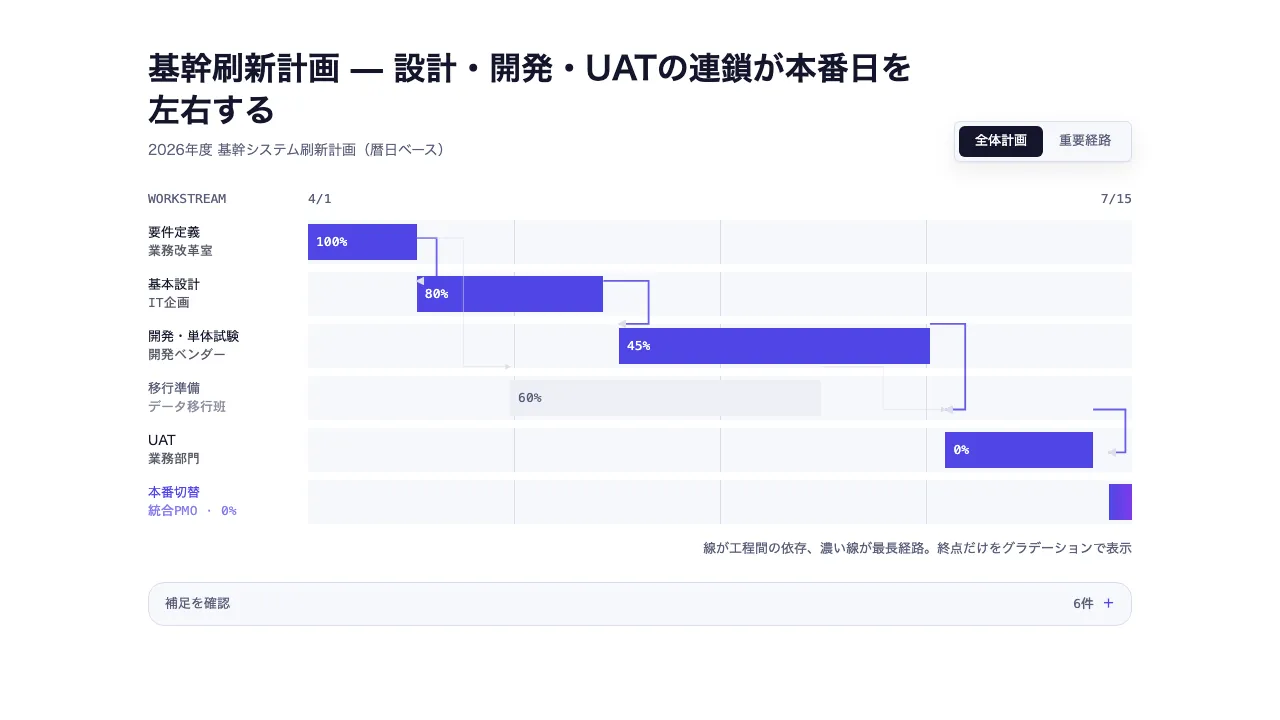
The plate on the left is not a drawing — it is the result of running sample data through the template. The input shape is fixed, so your own numbers give you a usable page.
The hand-off
One JSON per entry. The structured spec and a ready-to-send prompt both come from the same values, so neither can drift from what the page shows.
/ai/designs/break-even-inhouse-outsourcing.json /ai/designs.json /llms.txt
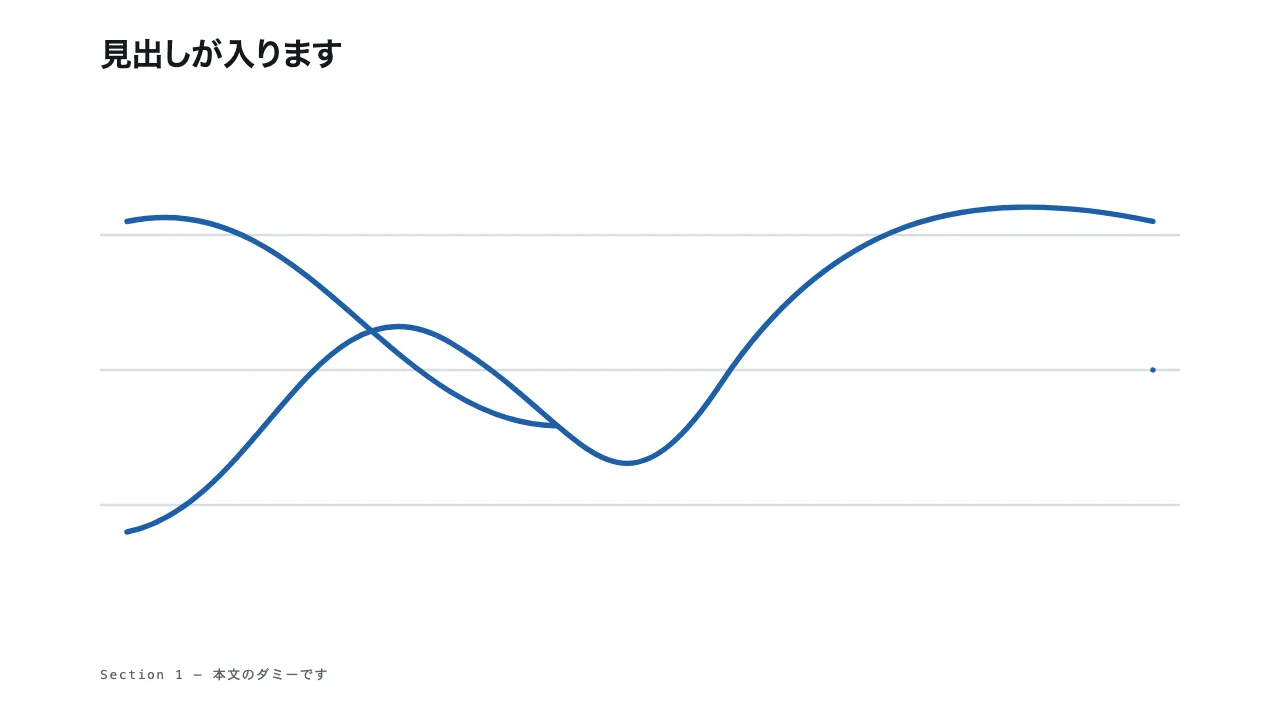
In-House and Outsourced Costs Cross at 600 Orders per Month {
"format": "slide-16x9",
"density": "medium",
"layout": {
"kind": "axis",
"canvas": {
"w": 1920,
"h": 1080
},
"margin": {
"top": 82,
"right": 120,
"bottom": 82,
"left": 120
}
},
"type": {
"title": {
"size": 44,
"weight": 700,
"tracking": "0.01em"
},
"subtitle": {
"size": 22,
"weight": 400
},
"axisTitle": {
"size": 20,
"weight": 500
},
"axisTick": {
"size": 20,
"weight": 400,
"numeric": "tabular"
},
"seriesLabel": {
"size": 22,
"weight": 700
},
"lineEnd": {
"size": 20,
"weight": 500,
"numeric": "tabular"
},
"crossingLabel": {
"size": 22,
"weight": 500
},
"crossingValue": {
"size": 30,
"weight": 700,
"numeric": "tabular"
},
"panelTitle": {
"size": 24,
"weight": 700
},
"panelValue": {
"size": 42,
"weight": 700,
"numeric": "tabular"
},
"panelCopy": {
"size": 20,
"weight": 400
},
"regionValue": {
"size": 22,
"weight": 700
},
"regionCopy": {
"size": 20,
"weight": 400
},
"assumption": {
"size": 20,
"weight": 400
},
"conclusion": {
"size": 26,
"weight": 500
}
},
"colors": {
"ground": "#FFFFFF",
"surface": "#F4F6F9",
"ink": "#131820",
"muted": "#667183",
"accent": "#1F5FA8",
"rule": "#DBE1E9",
"series": [
"#2F6FB5",
"#A85A2E"
]
},
"rules": [
"Plot total monthly cost, combining fixed and per-order charges. Comparing unit rates alone hides the effect of fixed costs.",
"The intersection is the equal-cost volume. Use the same scale to show which option costs less on either side.",
"State calculation assumptions and excluded costs. Quality differences, setup, or migration can move the break-even point.",
"This uses fictional rates and is not a recommendation for a real sourcing decision."
]
} Two axes — what you are making, and the skeleton — get you there.