Seen as a design The generated document itself — its toggles and disclosures work here
Seen as a design The generated document itself — its toggles and disclosures work here
Copy and paste, or save a file and hand it over. For a machine with no network, one “Everything” file is enough.
Everything in this panel, including the contents behind each URL, in one Markdown file — Large, so it goes as a file (copy is for 32 KB and under)
Build an HTML document with "Forecast Band". This layout runs, so there is no composition to rebuild — what it needs is content.

## What this layout does
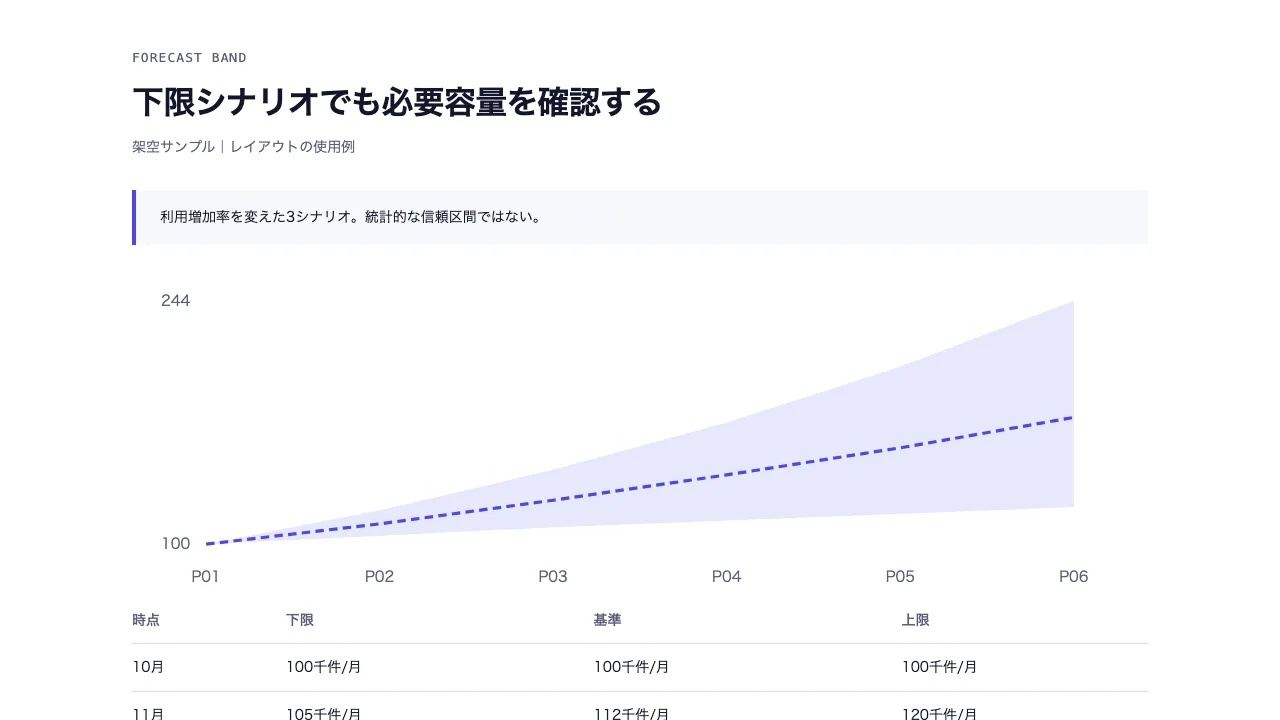
Forecast Band with explicit source values and reading conditions.

## What you have to supply
- Provide the source values, labels and decision conditions described by the schema.

## The shape of the input
- `title` — string — 結論を伝える見出し
- `subtitle` — string? — 出典・時点・母集団や仮定
- `unit` — string — 予測値の単位
- `basis` — string — 予測の前提と区間の意味
- `periods` — array (0, 1, 2) — 予測時点
- `low` — array () — 下限シナリオ
- `base` — array () — 基準シナリオ
- `high` — array () — 上限シナリオ

schema.ts holds the machine-checkable validation. Ask rather than guess when an input is missing.

## When not to use it
- Do not compare values with incompatible units, populations, or assumptions.

## How to build it
Put the input in a JSON file and run:

```bash
node scripts/render.mjs forecast-band <input.json> --theme ink -o out.html
```

The output is one self-contained file and fetches nothing at render time.

## The source
- https://design-vault.pages.dev/designs/forecast-band/source/template.tsx
- https://design-vault.pages.dev/designs/forecast-band/source/schema.ts
- https://design-vault.pages.dev/designs/forecast-band/source/sample-data.json
- https://design-vault.pages.dev/designs/forecast-band/sample.html
Template, input schema, sample data and metadata. This document was generated from those four. The generated document
/designs/forecast-band/source/template.tsx
import type { ReactNode } from "react";
import type { Props } from "./schema";


const fmt = (n: number) => Number.isInteger(n) ? n.toLocaleString("ja-JP") : n.toLocaleString("ja-JP", {maximumFractionDigits: 2});
function Ledger({heads,rows,caption}:{heads:string[];rows:ReactNode[][];caption?:string}) { return <table className="ledger">{caption && <caption>{caption}</caption>}<thead><tr>{heads.map((h,i)=><th key={i} scope="col">{h}</th>)}</tr></thead><tbody>{rows.map((r,i)=><tr key={i}>{r.map((v,j)=><td key={j} data-label={heads[j]}>{v}</td>)}</tr>)}</tbody></table>; }
function Notes({children}:{children:ReactNode}) { return <details><summary>データ・判断条件を確認</summary>{children}</details>; }
const points = (values:number[],max:number,min=0,width=820,height=230) => values.map((v,i)=>(70+i*width/Math.max(values.length-1,1))+","+(30+height-(v-min)/(max-min||1)*height)).join(" ");

const CSS = String.raw`
.asset{font-family:var(--font-sans);color:var(--color-primary);background:var(--color-surface);max-width:var(--container-slide);margin:auto;padding:3rem 2rem;line-height:1.6;font-size:var(--text-body-sm)}
.asset *{box-sizing:border-box}.asset header{margin-bottom:2rem}.asset .eyebrow{font-family:var(--font-mono);font-size:var(--text-label);letter-spacing:.08em;color:var(--color-secondary);margin-bottom:.75rem}.asset h1{font-size:var(--text-h1);font-weight:700;line-height:1.35;letter-spacing:-.025em;max-width:32em}.asset h2{font-size:var(--text-h3);font-weight:600;margin-bottom:.75rem}.asset h3{font-size:var(--text-body-md);font-weight:600}.asset .subtitle,.asset .muted{color:var(--color-secondary)}.asset .subtitle{margin-top:.75rem}.asset .number{font-variant-numeric:tabular-nums;font-family:var(--font-mono)}.asset .hero-number{font-size:var(--text-display);line-height:1.2;font-weight:700;letter-spacing:-.04em}.asset .callout{border-left:.25rem solid var(--color-tertiary);padding:1rem 1.5rem;background:var(--color-surface-subtle);margin-bottom:1.5rem}.asset .grid2{display:grid;grid-template-columns:1fr 1fr;gap:1.5rem}.asset .grid3{display:grid;grid-template-columns:repeat(3,minmax(0,1fr));gap:1.5rem}.asset .panel{padding:1.5rem;background:var(--color-surface-subtle);border-radius:var(--radius-md);min-width:0}.asset .rule{border-top:1px solid var(--color-outline);padding-top:1rem;margin-top:1rem}.asset .pill{display:inline-block;padding:.25rem .75rem;border:1px solid var(--color-outline);border-radius:var(--radius-full);font-size:var(--text-label)}.asset .focus{background:var(--color-tertiary-container);color:var(--color-on-tertiary-container)}.asset .dark{background:var(--color-primary);color:var(--color-on-primary)}.asset .dark .muted{color:var(--color-on-primary-container)}.asset .row{display:grid;grid-template-columns:12rem minmax(0,1fr) 6rem;gap:1rem;align-items:center;padding:.75rem 0;border-bottom:1px solid var(--color-outline)}.asset .row>*{min-width:0}.asset .track{height:1rem;position:relative;background:var(--color-neutral);border-radius:var(--radius-sm)}.asset .bar{height:100%;background:var(--color-tertiary);border-radius:var(--radius-sm)}.asset .track.tall{height:2rem}.asset .flex{display:flex;gap:1rem;align-items:center;justify-content:space-between;flex-wrap:wrap}.asset .stack>*+*{margin-top:1rem}.asset ul{list-style:disc;padding-left:1.25rem}.asset li+li{margin-top:.5rem}.asset .plot{display:block;width:100%;height:auto;overflow:visible}.asset .plot text{font-family:var(--font-sans);font-size:14px;fill:var(--color-secondary)}.asset .plot .ink{fill:var(--color-primary)}.asset .plot .axis{stroke:var(--color-outline);stroke-width:1}.asset .plot .accent{stroke:var(--color-tertiary);fill:none;stroke-width:3}.asset .legend{display:flex;gap:1.5rem;flex-wrap:wrap;font-size:var(--text-label);margin-bottom:1rem}.asset .legend b{display:inline-block;width:.75rem;height:.75rem;margin-right:.5rem}.asset .ledger{border-collapse:collapse;width:100%;font-variant-numeric:tabular-nums}.asset .ledger caption{text-align:left;font-weight:600;margin:1rem 0}.asset .ledger th{font-weight:600;color:var(--color-secondary);text-align:left}.asset .ledger th,.asset .ledger td{padding:.75rem 1rem;border-bottom:1px solid var(--color-outline);vertical-align:top;overflow-wrap:anywhere}.asset .ledger th:first-child,.asset .ledger td:first-child{padding-left:0}.asset .ledger th:last-child,.asset .ledger td:last-child{padding-right:0}.asset .ledger tbody tr:hover{background:var(--color-surface-subtle)}.asset details{border-top:1px solid var(--color-outline);margin-top:1.5rem;padding-top:1rem}.asset summary{cursor:pointer;color:var(--color-secondary);padding:.5rem 0;min-height:2.75rem}.asset summary:focus-visible{outline:2px solid var(--color-tertiary);outline-offset:.25rem}.asset .small{font-size:var(--text-label)}.asset .mobile-only{display:none}.asset .horizontal-list{display:grid;grid-template-columns:repeat(3,minmax(0,1fr));gap:1rem}.asset .board-column{border-top:.25rem solid var(--color-primary);padding-top:1rem;min-width:0}.asset .board-item{padding:1rem 0;border-bottom:1px solid var(--color-outline)}.asset .board-item p{margin-top:.5rem}.asset .statement{font-size:var(--text-h2);line-height:1.5;font-weight:600}.asset .meta-line{margin-top:.75rem;font-size:var(--text-label);color:var(--color-secondary)}.asset pre{white-space:pre-wrap;overflow-wrap:anywhere}.asset footer{margin-top:2rem;font-size:var(--text-label);color:var(--color-secondary)}
@media(max-width:640px){.asset{padding:1.5rem 1rem}.asset h1{font-size:var(--text-h2)}.asset header{margin-bottom:1.5rem}.asset .grid2,.asset .grid3,.asset .horizontal-list{grid-template-columns:1fr}.asset .row{grid-template-columns:minmax(0,1fr) 5rem;gap:.5rem}.asset .row>:first-child{grid-column:1/-1}.asset .desktop-only{display:none!important}.asset .mobile-only{display:block}.asset .panel{padding:1rem}.asset .ledger,.asset .ledger tbody,.asset .ledger tr,.asset .ledger td{display:block}.asset .ledger thead{display:none}.asset .ledger tr{padding:.75rem 0;border-bottom:1px solid var(--color-outline)}.asset .ledger td{display:grid;grid-template-columns:7rem minmax(0,1fr);gap:.75rem;border:0;padding:.25rem 0!important}.asset .ledger td:before{content:attr(data-label);color:var(--color-secondary);font-size:var(--text-label)}.asset .hero-number{font-size:var(--text-h1)}}
@media print{.asset{max-width:none;padding:1rem}.asset details>*{display:block}.asset summary{display:none}}
`;

export default function Template(d: Props) {
const lo=Math.min(...d.low),hi=Math.max(...d.high),upper=points(d.high,hi,lo),lower=points(d.low,hi,lo).split(" ").reverse().join(" ");
return <section className="asset asset-forecast-band"><style>{CSS}</style><header><p className="eyebrow">FORECAST BAND</p><h1>{d.title}</h1>{d.subtitle && <p className="subtitle">{d.subtitle}</p>}</header>
<p className="callout">{d.basis}</p><svg className="plot desktop-only" viewBox="0 0 960 310" role="img" aria-label="予測シナリオの上下限帯"><polygon points={upper+" "+lower} fill="var(--color-tertiary-container)"/><polyline points={points(d.base,hi,lo)} className="accent" strokeDasharray="8 5"/>{[lo,hi].map((v,i)=><text key={i} x="55" y={265-(v-lo)/(hi-lo||1)*230} textAnchor="end">{fmt(v)}</text>)}{d.periods.map((_,i)=><text key={i} x={70+i*820/(d.periods.length-1)} y="296" textAnchor="middle">P{String(i+1).padStart(2,"0")}</text>)}</svg><Ledger heads={["時点","下限","基準","上限"]} rows={d.periods.map((p,i)=>[p,d.low[i]+d.unit,d.base[i]+d.unit,d.high[i]+d.unit])}/><Notes><p>破線は基準シナリオ。実績との境界や予測手法は前提欄で明示し、帯の幅を確率と解釈しません。</p></Notes>
<footer>全点で下限≦基準≦上限。帯の定義は前提欄で示す。</footer></section>;
}
/designs/forecast-band/source/schema.ts
import { z } from "zod";
const text = z.string().trim().min(1).max(160);
const short = z.string().trim().min(1).max(48);
const value = z.number().finite();
const positive = value.positive();
const unique = (values: string[]) => new Set(values).size === values.length;

export const schema = z.object({
  title: text.describe("結論を伝える見出し"),
  subtitle: text.optional().describe("出典・時点・母集団や仮定"),
  unit:short.describe("予測値の単位"),basis:text.describe("予測の前提と区間の意味"),
  periods:z.array(short).min(3).max(10).describe("予測時点"),low:z.array(value).min(3).max(10).describe("下限シナリオ"),base:z.array(value).min(3).max(10).describe("基準シナリオ"),high:z.array(value).min(3).max(10).describe("上限シナリオ"),
}).strict().refine(d=>unique(d.periods)&&d.low.length===d.periods.length&&d.base.length===d.periods.length&&d.high.length===d.periods.length&&d.low.every((v,i)=>v<=d.base[i]&&d.base[i]<=d.high[i]),"配列長と上下限の順序を揃える");
export type Props = z.infer<typeof schema>;
/designs/forecast-band/source/meta.yaml
id: forecast-band
name:
  ja: 予測のシナリオ帯
  en: Forecast Band
purpose:
  ja: 将来値の下限・基準・上限を時間軸上の帯として比較する。
  en: Forecast Band with explicit source values and reading conditions.
status: published
still: ./still.png
category: analysis
catalogOrder: 410
jobs:
  - measure-change
useCases:
  - kpi
layoutKinds:
  - timeline
tags:
  - forecast-band
  - analysis
  - offline
  - responsive
whenToUse:
  - ja: 将来値の下限・基準・上限を時間軸上の帯として比較する。
    en: Use to communicate forecast band.
avoidWhen:
  - ja: 同じ条件・単位で比較できないデータには使わない
    en: Do not compare values with incompatible units, populations, or assumptions.
requiredInputs:
  - ja: 全点で下限≦基準≦上限。帯の定義は前提欄で示す。
    en: Provide the source values, labels and decision conditions described by the schema.
relatedLayouts:
  - interval-estimates
  - line-trend
dataSchema:
  title: string — 結論を伝える見出し
  subtitle: string? — 出典・時点・母集団や仮定
  unit: string — 予測値の単位
  basis: string — 予測の前提と区間の意味
  periods: array (0, 1, 2) — 予測時点
  low: array () — 下限シナリオ
  base: array () — 基準シナリオ
  high: array () — 上限シナリオ
sources: []
/designs/forecast-band/source/sample-data.json
{
  "title": "下限シナリオでも必要容量を確認する",
  "subtitle": "架空サンプル|レイアウトの使用例",
  "unit": "千件/月",
  "basis": "利用増加率を変えた3シナリオ。統計的な信頼区間ではない。",
  "periods": [
    "10月",
    "11月",
    "12月",
    "1月",
    "2月",
    "3月"
  ],
  "low": [
    100,
    105,
    110,
    114,
    118,
    122
  ],
  "base": [
    100,
    112,
    126,
    141,
    157,
    175
  ],
  "high": [
    100,
    120,
    144,
    172,
    205,
    244
  ]
}