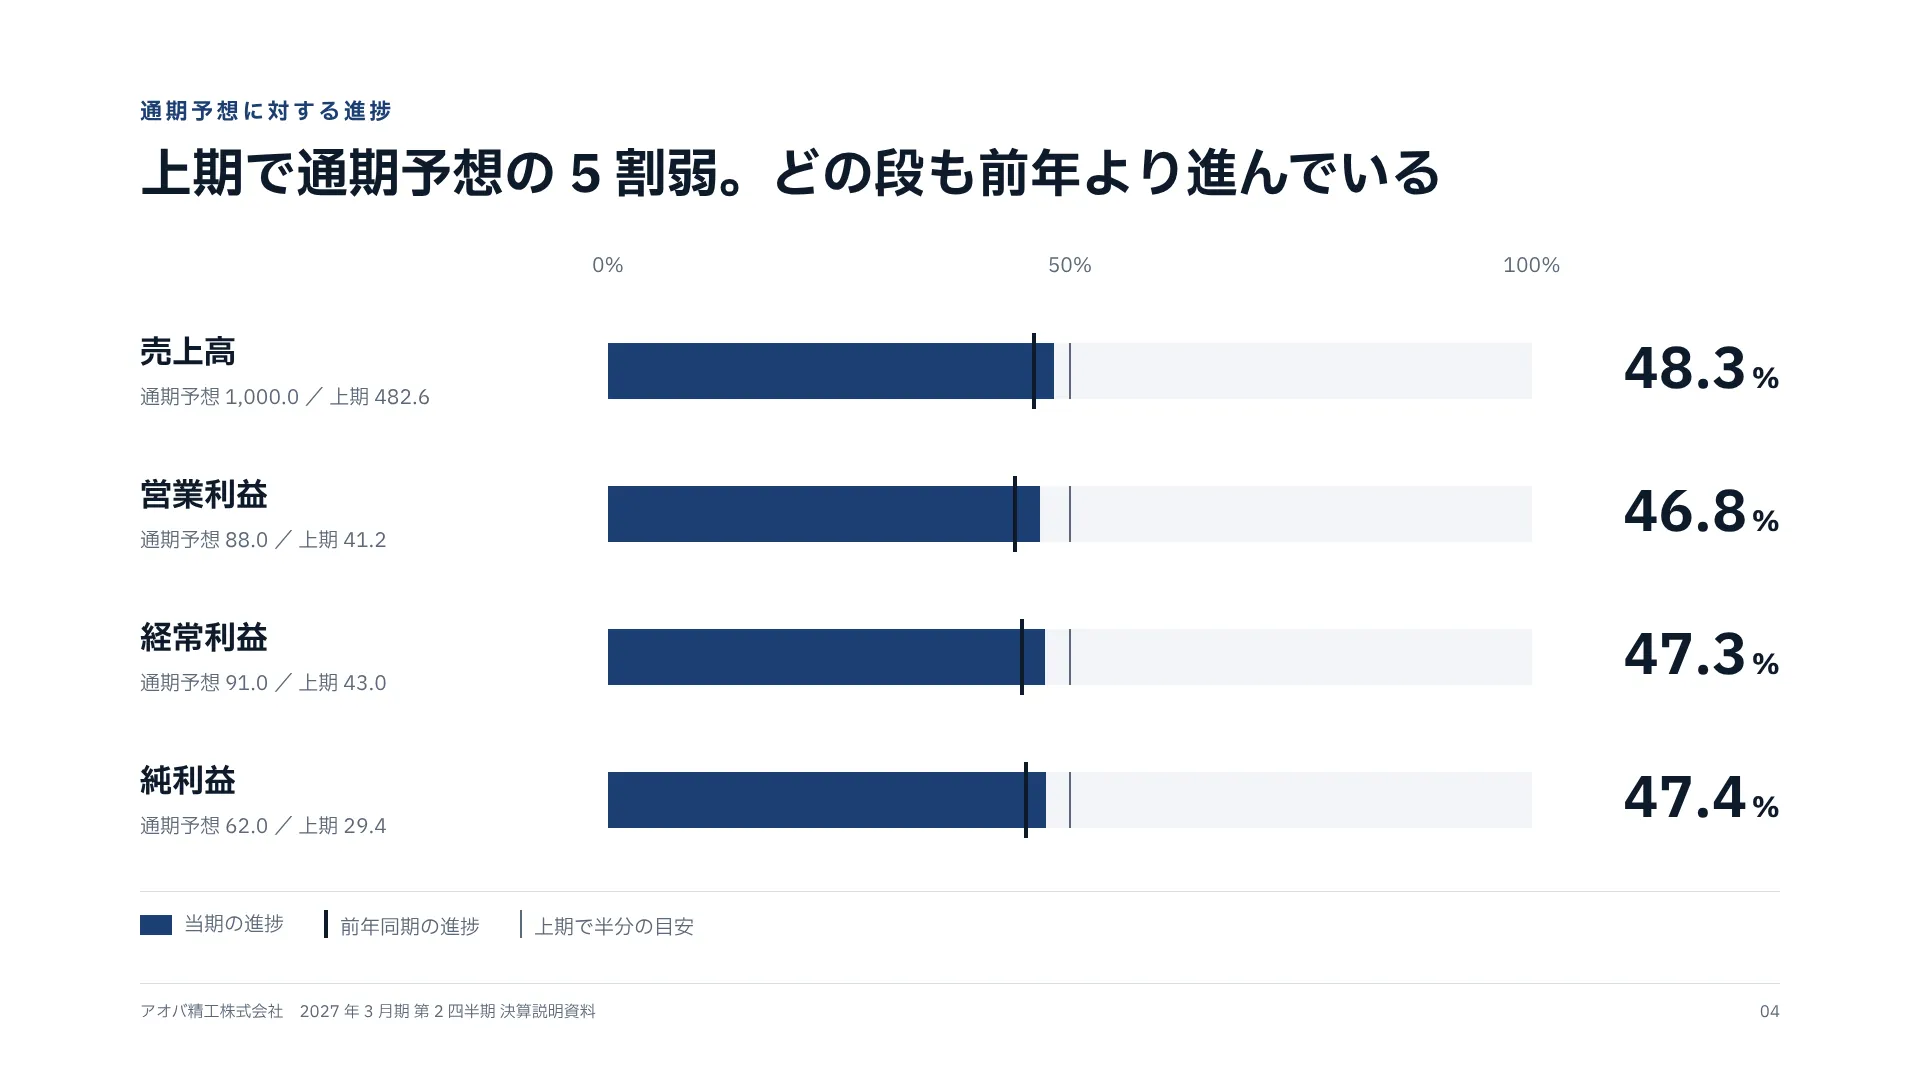
As measured
1920 × 1080 Seen as a design The artboard itself, drawn live — sharp at any zoom Structure, margins and columns overlaid
1920 × 1080 Seen as a design The artboard itself, drawn live — sharp at any zoom Structure, margins and columns overlaid
Copy and paste, or save a file and hand it over. For a machine with no network, one “Everything” file is enough.
Everything in this panel, including the contents behind each URL, in one Markdown file — Large, so it goes as a file (copy is for 32 KB and under)
Produce one slide to the following specification.

- Canvas 1920 × 1080
- Margin top 96 right 140 bottom 56 left 140

## Type (px against a 1920px canvas)
kicker  22px / 700 / tracking 0.16em / tabular numerals
title  52px / 700 / leading 1.35 / tabular numerals
tick  20px / 400 / tabular numerals
item  32px / 700 / tabular numerals
plan  20px / 400 / tabular numerals
rate  56px / 700 / leading 1 / tabular numerals
legend  20px / 400 / tabular numerals
folio  16px / 400 / tabular numerals

## Colour
Ground #FFFFFF / Surface #F2F4F8 / Ink #0E1A2B / Muted #5B6879 / Accent #1D3F72 / Rule #D6DCE5

## Constraints — dropping these breaks it
- The bar ends at the full-year forecast — scale to amounts and the lines cannot be compared
- Mark last year's progress as a tick — a progress rate alone cannot be judged high or low
- For a half year, draw a thin line at 50%; note any seasonality
- The rate goes large at the right; forecast and actual sit small under each line's name

Replace the content with [your content]. Keep the measurements and colours as given.
For an exact reproduction, use the verbatim HTML at https://design-vault.pages.dev/designs/forecast-progress-rate/pattern.html.
/ai/designs/forecast-progress-rate.json
format: slide-16x9
density: medium
layout:
  kind: axis
  canvas:
    w: 1920
    h: 1080
  margin:
    top: 96
    right: 140
    bottom: 56
    left: 140
type:
  kicker:
    size: 22
    weight: 700
    tracking: 0.16em
    numeric: tabular
  title:
    size: 52
    weight: 700
    leading: 1.35
    numeric: tabular
  tick:
    size: 20
    weight: 400
    numeric: tabular
  item:
    size: 32
    weight: 700
    numeric: tabular
  plan:
    size: 20
    weight: 400
    numeric: tabular
  rate:
    size: 56
    weight: 700
    leading: 1
    numeric: tabular
  legend:
    size: 20
    weight: 400
    numeric: tabular
  folio:
    size: 16
    weight: 400
    numeric: tabular
colors:
  ground: "#FFFFFF"
  surface: "#F2F4F8"
  ink: "#0E1A2B"
  muted: "#5B6879"
  accent: "#1D3F72"
  rule: "#D6DCE5"
rules:
  - The bar ends at the full-year forecast — scale to amounts and the lines cannot be compared
  - Mark last year's progress as a tick — a progress rate alone cannot be judged high or low
  - For a half year, draw a thin line at 50%; note any seasonality
  - The rate goes large at the right; forecast and actual sit small under each line's name
{
"format": "slide-16x9",
"density": "medium",
"layout": {
"kind": "axis",
"canvas": {
"w": 1920,
"h": 1080
},
"margin": {
"top": 96,
"right": 140,
"bottom": 56,
"left": 140
}
},
"type": {
"kicker": {
"size": 22,
"weight": 700,
"tracking": "0.16em",
"numeric": "tabular"
},
"title": {
"size": 52,
"weight": 700,
"leading": 1.35,
"numeric": "tabular"
},
"tick": {
"size": 20,
"weight": 400,
"numeric": "tabular"
},
"item": {
"size": 32,
"weight": 700,
"numeric": "tabular"
},
"plan": {
"size": 20,
"weight": 400,
"numeric": "tabular"
},
"rate": {
"size": 56,
"weight": 700,
"leading": 1,
"numeric": "tabular"
},
"legend": {
"size": 20,
"weight": 400,
"numeric": "tabular"
},
"folio": {
"size": 16,
"weight": 400,
"numeric": "tabular"
}
},
"colors": {
"ground": "#FFFFFF",
"surface": "#F2F4F8",
"ink": "#0E1A2B",
"muted": "#5B6879",
"accent": "#1D3F72",
"rule": "#D6DCE5"
},
"rules": [
"The bar ends at the full-year forecast — scale to amounts and the lines cannot be compared",
"Mark last year's progress as a tick — a progress rate alone cannot be judged high or low",
"For a half year, draw a thin line at 50%; note any seasonality",
"The rate goes large at the right; forecast and actual sit small under each line's name"
]
} /designs/forecast-progress-rate/pattern.html — The artboard itself, font subset included — open it and this picture draws.
<!doctype html>
<meta charset="utf-8">
<title>通期予想への進捗 — 100% の帯に当期を塗り、前年同期を目盛りで重ねる</title>
<meta name="dv-font" content="IBM Plex Sans JP:400;500;700">
<link rel="stylesheet" href="./font.css">
<style>
  /* この版そのもの。index.md の layout / type / colors は、この HTML を
     scripts/render-pattern.mjs で実測した結果であって、別に書いた説明ではない。
     会社・人物・数値はすべて説明用の架空のもの。 */
  :root {
    --ground: #FFFFFF;
    --surface: #F2F4F8;
    --ink: #0E1A2B;
    --muted: #5B6879;
    --accent: #1D3F72;
    --rule: #D6DCE5;
  }
  * { box-sizing: border-box; margin: 0; }
  html, body { width: 1920px; height: 1080px; }
  body { font-family: "IBM Plex Sans JP", "IPAGothic", sans-serif; font-variant-numeric: tabular-nums; }

  .artboard {
    width: 1920px; height: 1080px;
    background: var(--ground); color: var(--ink);
    padding: 96px 140px 56px;             /* → layout.margin */
  }
  .content { height: 100%; display: grid; grid-template-rows: auto 1fr auto; row-gap: 40px; }

  .kicker { font-size: 22px; font-weight: 700; letter-spacing: .16em; color: var(--accent); }
  .title { font-size: 52px; font-weight: 700; line-height: 1.35; margin-top: 12px; }
  /* 頁の足:社名・資料名・頁番号。どの頁でも同じ位置に置く */
  .folio { display: flex; justify-content: space-between; font-size: 16px; color: var(--muted); border-top: 1px solid var(--rule); padding-top: 16px; }

  .chart { display: grid; grid-template-rows: auto 1fr auto; row-gap: 20px; }
  .scale { display: grid; grid-template-columns: 420px 1fr 200px; column-gap: 48px; }
  .ticks { position: relative; height: 28px; }
  .ticks span { position: absolute; transform: translateX(-50%); font-size: 20px; color: var(--muted); }
  .rows { display: grid; grid-template-rows: repeat(4, 1fr); align-items: center; }
  .row { display: grid; grid-template-columns: 420px 1fr 200px; column-gap: 48px; align-items: center; }
  .name { font-size: 32px; font-weight: 700; }
  .plan { font-size: 20px; color: var(--muted); margin-top: 6px; }
  /* 帯は 100%(通期予想)まで。50% の細い線が「上期で半分」の目安 */
  .track { position: relative; height: 56px; background: var(--surface); background-image: linear-gradient(var(--muted), var(--muted)); background-size: 2px 100%; background-position: 50% 0; background-repeat: no-repeat; }
  .fill { position: absolute; left: 0; top: 0; bottom: 0; background: var(--accent); }
  .prev { position: absolute; top: -10px; bottom: -10px; width: 4px; margin-left: -2px; background: var(--ink); }
  .rate { font-size: 56px; font-weight: 700; text-align: right; line-height: 1; }
  .rate small { font-size: 28px; margin-left: 4px; }
  .legend { display: flex; gap: 40px; font-size: 20px; color: var(--muted); border-top: 1px solid var(--rule); padding-top: 18px; }
  .legend i { display: inline-block; vertical-align: -4px; margin-right: 12px; }
  .k1 { width: 32px; height: 20px; background: var(--accent); }
  .k2 { width: 4px; height: 28px; background: var(--ink); }
  .k3 { width: 2px; height: 28px; background: var(--muted); }

</style>

<div class="artboard" data-artboard>
  <div class="content" data-content>
    <div>
      <p class="kicker" data-type="kicker">通期予想に対する進捗</p>
      <h1 class="title" data-type="title">上期で通期予想の 5 割弱。どの段も前年より進んでいる</h1>
    </div>
    <div class="chart">
      <div class="scale"><span></span><div class="ticks"><span style="left: 0" data-type="tick">0%</span><span style="left: 50%">50%</span><span style="left: 100%">100%</span></div><span></span></div>
      <div class="rows">
      <div class="row">
        <div><p class="name" data-type="item">売上高</p><p class="plan" data-type="plan">通期予想 1,000.0 / 上期 482.6</p></div>
        <div class="track"><span class="fill" style="width: 48.3%"></span><span class="prev" style="left: 46.1%"></span></div>
        <p class="rate" data-type="rate">48.3<small>%</small></p>
      </div>
      <div class="row">
        <div><p class="name">営業利益</p><p class="plan">通期予想 88.0 / 上期 41.2</p></div>
        <div class="track"><span class="fill" style="width: 46.8%"></span><span class="prev" style="left: 44.0%"></span></div>
        <p class="rate">46.8<small>%</small></p>
      </div>
      <div class="row">
        <div><p class="name">経常利益</p><p class="plan">通期予想 91.0 / 上期 43.0</p></div>
        <div class="track"><span class="fill" style="width: 47.3%"></span><span class="prev" style="left: 44.8%"></span></div>
        <p class="rate">47.3<small>%</small></p>
      </div>
      <div class="row">
        <div><p class="name">純利益</p><p class="plan">通期予想 62.0 / 上期 29.4</p></div>
        <div class="track"><span class="fill" style="width: 47.4%"></span><span class="prev" style="left: 45.2%"></span></div>
        <p class="rate">47.4<small>%</small></p>
      </div>
      </div>
      <div class="legend"><p data-type="legend"><i class="k1"></i>当期の進捗</p><p><i class="k2"></i>前年同期の進捗</p><p><i class="k3"></i>上期で半分の目安</p></div>
    </div>
    <div class="folio">
      <p data-type="folio">アオバ精工株式会社 2027 年 3 月期 第 2 四半期 決算説明資料</p>
      <p>04</p>
    </div>
  </div>
</div>
/designs/forecast-progress-rate/font.css — Not in Everything
/* dv-subset v2 — generated by scripts/subset-font.mjs. Do not edit.
 * font    IBM Plex Sans JP 400;500;700
 * chars   83 (a8f017d7ddc98b0f)
 *
 * pattern.html の文字だけを含む部分集合。描画時に外部へ取りに行かないよう同梱する。
 * 版の文字を変えたら取り直すこと — 忘れると足りない字が豆腐になる。
 * その取り忘れは pattern-entries.test.ts が上の指紋で検出する。
 */

@font-face {
  font-family: 'IBM Plex Sans JP';
  font-style: normal;
  font-weight: 400;
  font-display: block;
  src: url(./font-0.woff2) format('woff2');
  unicode-range: U+20, U+25, U+2c, U+2e, U+30-39, U+2014, U+3000-3002, U+3044, U+3059-305a, U+3066-3069, U+306b, U+306d-306e, U+3078-3079, U+3082, U+3088, U+308a-308b, U+3092-3093, U+3099, U+30a2, U+30aa, U+30cf-30d0, U+4e0a, U+4e88, U+4f1a, U+5206, U+5229, U+524d, U+5272, U+534a, U+540c, U+55b6, U+56db, U+5857, U+58f2, U+5b89, U+5bfe, U+5de5, U+5e2f, U+5e38, U+5e74, U+5f0f, U+5f31, U+5f53, U+60f3, U+6357, U+6599, U+660e, U+6708, U+671f, U+682a, U+696d, U+6bb5, U+6c7a, U+76ca, U+76db, U+76ee, U+793e, U+7b2c, U+7b97, U+7cbe, U+7d14, U+7d4c, U+8aac, U+8cc7, U+901a, U+9032, U+91cd, U+9ad8, U+ff0f;
}
@font-face {
  font-family: 'IBM Plex Sans JP';
  font-style: normal;
  font-weight: 500;
  font-display: block;
  src: url(./font-1.woff2) format('woff2');
  unicode-range: U+20, U+25, U+2c, U+2e, U+30-39, U+2014, U+3000-3002, U+3044, U+3059-305a, U+3066-3069, U+306b, U+306d-306e, U+3078-3079, U+3082, U+3088, U+308a-308b, U+3092-3093, U+3099, U+30a2, U+30aa, U+30cf-30d0, U+4e0a, U+4e88, U+4f1a, U+5206, U+5229, U+524d, U+5272, U+534a, U+540c, U+55b6, U+56db, U+5857, U+58f2, U+5b89, U+5bfe, U+5de5, U+5e2f, U+5e38, U+5e74, U+5f0f, U+5f31, U+5f53, U+60f3, U+6357, U+6599, U+660e, U+6708, U+671f, U+682a, U+696d, U+6bb5, U+6c7a, U+76ca, U+76db, U+76ee, U+793e, U+7b2c, U+7b97, U+7cbe, U+7d14, U+7d4c, U+8aac, U+8cc7, U+901a, U+9032, U+91cd, U+9ad8, U+ff0f;
}
@font-face {
  font-family: 'IBM Plex Sans JP';
  font-style: normal;
  font-weight: 700;
  font-display: block;
  src: url(./font-2.woff2) format('woff2');
  unicode-range: U+20, U+25, U+2c, U+2e, U+30-39, U+2014, U+3000-3002, U+3044, U+3059-305a, U+3066-3069, U+306b, U+306d-306e, U+3078-3079, U+3082, U+3088, U+308a-308b, U+3092-3093, U+3099, U+30a2, U+30aa, U+30cf-30d0, U+4e0a, U+4e88, U+4f1a, U+5206, U+5229, U+524d, U+5272, U+534a, U+540c, U+55b6, U+56db, U+5857, U+58f2, U+5b89, U+5bfe, U+5de5, U+5e2f, U+5e38, U+5e74, U+5f0f, U+5f31, U+5f53, U+60f3, U+6357, U+6599, U+660e, U+6708, U+671f, U+682a, U+696d, U+6bb5, U+6c7a, U+76ca, U+76db, U+76ee, U+793e, U+7b2c, U+7b97, U+7cbe, U+7d14, U+7d4c, U+8aac, U+8cc7, U+901a, U+9032, U+91cd, U+9ad8, U+ff0f;
}
出典を持たない自作パターン。pattern.html が版そのもので、cover.png と frontmatter の
layout / type / colors はどちらもそこから機械的に測った結果。一式「決算・経営報告」の
1 枚で、架空の会社「アオバ精工」の第 2 四半期決算説明として描いてある。会社・人物・数値はすべて架空。
A self-authored pattern. pattern.html is the artboard itself; both cover.png and the
measurements in the frontmatter are derived from it. One of the eight results-briefing slides, drawn
as a fictional company’s half-year results deck; every company, person and figure on it is invented.