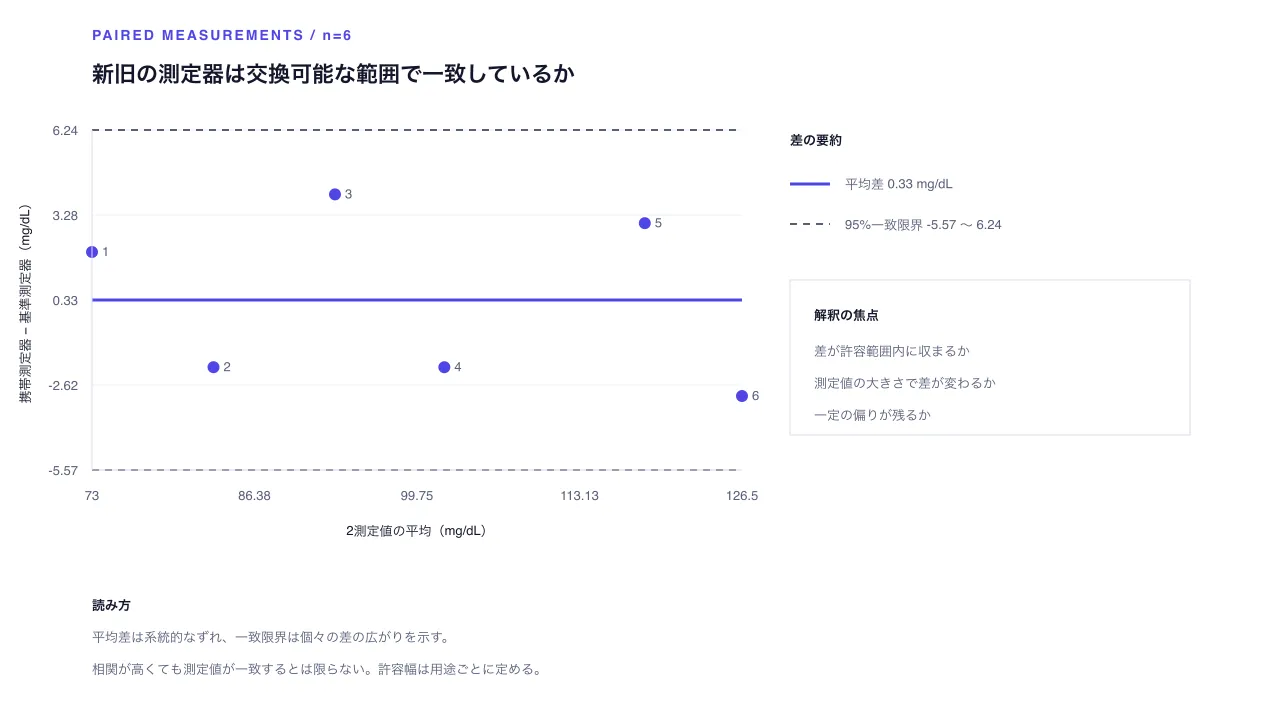
Seen as a design The generated document itself — its toggles and disclosures work here
Seen as a design The generated document itself — its toggles and disclosures work here
Copy and paste, or save a file and hand it over. For a machine with no network, one “Everything” file is enough.
Everything in this panel, including the contents behind each URL, in one Markdown file — Large, so it goes as a file (copy is for 32 KB and under)
Build an HTML document with "Paired Measurement Agreement". This layout runs, so there is no composition to rebuild — what it needs is content.

## What this layout does
Plot paired method differences against pair means to inspect bias and 95% limits of agreement.

## What you have to supply
- Pair the two method values for each same subject.
- Provide a common unit; mean difference and sample standard deviation determine agreement limits.

## The shape of the input
- `title` — string — 結論を伝える見出し
- `subtitle` — string? — 対象・測定条件
- `methodA, methodB, unit` — string — 異なる測定法と共通単位
- `pairs` — array (id, label, valueA, valueB) — 同一対象の対応測定4〜12組

schema.ts holds the machine-checkable validation. Ask rather than guess when an input is missing.

## When not to use it
- Use a scatter plot for association; correlation alone does not establish agreement.
- Do not use without paired measurements from the same subjects.

## How to build it
Put the input in a JSON file and run:

```bash
node scripts/render.mjs measurement-agreement <input.json> --theme ink -o out.html
```

The output is one self-contained file and fetches nothing at render time.

## The source
- https://design-vault.pages.dev/designs/measurement-agreement/source/template.tsx
- https://design-vault.pages.dev/designs/measurement-agreement/source/schema.ts
- https://design-vault.pages.dev/designs/measurement-agreement/source/sample-data.json
- https://design-vault.pages.dev/designs/measurement-agreement/sample.html
Template, input schema, sample data and metadata. This document was generated from those four. The generated document
/designs/measurement-agreement/source/template.tsx
import type { Props } from "./schema";

const CSS = ".asset{font-family:var(--font-sans);color:var(--color-on-surface);background:var(--color-surface);max-width:var(--container-slide);margin:auto;padding:2rem;line-height:1.5}.asset *{box-sizing:border-box}.asset h1{font-size:var(--text-h1);line-height:1.3;margin:0}.asset .sub{color:var(--color-secondary);margin:.5rem 0 1rem}.asset .plot{display:block;width:100%;height:auto}.asset table{border-collapse:collapse;width:100%;font-variant-numeric:tabular-nums}.asset th,.asset td{text-align:left;padding:.55rem .65rem;border-bottom:1px solid var(--color-outline);overflow-wrap:anywhere}.asset th{color:var(--color-secondary)}.asset .mono{font-family:var(--font-mono)}@media(max-width:640px){.asset{padding:1rem}.asset h1{font-size:var(--text-h2)}table,tbody,tr,td{display:block}.asset thead{display:none}.asset tr{padding:.4rem 0;border-bottom:1px solid var(--color-outline)}.asset td{display:grid;grid-template-columns:9rem minmax(0,1fr);gap:.5rem;border:0;padding:.2rem}.asset td:before{content:attr(data-label);color:var(--color-secondary)}}";
const mean = (d: Props) => d.pairs.reduce((s, p) => s + p.valueB - p.valueA, 0) / d.pairs.length;
const sd = (d: Props) => Math.sqrt(d.pairs.reduce((s, p) => s + Math.pow(p.valueB - p.valueA - mean(d), 2), 0) / (d.pairs.length - 1));
const limits = (d: Props) => [mean(d) - 1.96 * sd(d), mean(d), mean(d) + 1.96 * sd(d)];
const fmt = (n: number) => n.toLocaleString("ja-JP", { maximumFractionDigits: 2 });

export default function Template(d: Props) {
  const avg = mean(d), [low, , high] = limits(d);
  const xs = d.pairs.map(p => (p.valueA + p.valueB) / 2), ys = d.pairs.map(p => p.valueB - p.valueA);
  const minX = Math.min(...xs), maxX = Math.max(...xs), spanX = maxX - minX || 1;
  const minY = Math.min(low, ...ys), maxY = Math.max(high, ...ys), spanY = maxY - minY || 1;
  const x = (v: number) => 92 + (v - minX) / spanX * 650;
  const y = (v: number) => 470 - (v - minY) / spanY * 340;
  return <section className="asset asset-measurement-agreement"><style>{CSS}</style>
    <header><p>MEASUREMENT AGREEMENT / BLAND–ALTMAN</p><h1>{d.title}</h1>{d.subtitle && <p className="sub">{d.subtitle}</p>}</header>
    <svg className="plot" data-layout-still="true" width="1280" height="720" viewBox="0 0 1280 720" role="img" aria-label={`${d.methodA}と${d.methodB}の一致性`} fontFamily="sans-serif" fontSize="13" fill="var(--color-secondary)">
      <title>{d.title}</title><desc>横軸は2測定値の平均、縦軸は{d.methodB}−{d.methodA}。平均差 {fmt(avg)}、95%一致限界 {fmt(low)}から{fmt(high)}{d.unit}。</desc>
      <rect x="0" y="0" width="1280" height="720" fill="var(--color-surface)"/>
      <text x="92" y="40" fontSize="14" fontWeight="700" letterSpacing="2" fill="var(--color-tertiary)">PAIRED MEASUREMENTS / n={d.pairs.length}</text>
      <text x="92" y="82" fontSize="22" fontWeight="700" fill="var(--color-on-surface)">{d.title}</text>
      {[0,.25,.5,.75,1].map((t,i)=><g key={i}><line x1="92" x2="742" y1={130+t*340} y2={130+t*340} stroke="var(--color-outline)" opacity=".5"/><text x="78" y={135+t*340} textAnchor="end">{fmt(maxY-t*spanY)}</text><text x={92+t*650} y="500" textAnchor="middle">{fmt(minX+t*spanX)}</text></g>)}
      <line x1="92" x2="742" y1={y(high)} y2={y(high)} stroke="var(--color-secondary)" strokeDasharray="7 6" strokeWidth="2"/>
      <line x1="92" x2="742" y1={y(avg)} y2={y(avg)} stroke="var(--color-tertiary)" strokeWidth="3"/>
      <line x1="92" x2="742" y1={y(low)} y2={y(low)} stroke="var(--color-secondary)" strokeDasharray="7 6" strokeWidth="2"/>
      {d.pairs.map((p,i)=><g key={p.id} data-agreement-pair={p.id}><circle cx={x((p.valueA+p.valueB)/2)} cy={y(p.valueB-p.valueA)} r="7" fill="var(--color-tertiary)" stroke="var(--color-surface)" strokeWidth="2"/><text x={x((p.valueA+p.valueB)/2)+10} y={y(p.valueB-p.valueA)+4}>{i+1}</text></g>)}
      <line x1="92" x2="742" y1="470" y2="470" stroke="var(--color-outline)"/><line x1="92" x2="92" y1="130" y2="470" stroke="var(--color-outline)"/>
      <text x="420" y="535" textAnchor="middle" fill="var(--color-on-surface)">2測定値の平均({d.unit})</text><text x="30" y="300" textAnchor="middle" transform="rotate(-90 30 300)" fill="var(--color-on-surface)">{d.methodB} − {d.methodA}({d.unit})</text>
      <text x="790" y="145" fontWeight="700" fill="var(--color-on-surface)">差の要約</text><line x1="790" x2="830" y1="184" y2="184" stroke="var(--color-tertiary)" strokeWidth="3"/><text x="845" y="189">平均差 {fmt(avg)} {d.unit}</text>
      <line x1="790" x2="830" y1="224" y2="224" stroke="var(--color-secondary)" strokeDasharray="7 6" strokeWidth="2"/><text x="845" y="229">95%一致限界 {fmt(low)} ~ {fmt(high)}</text>
      <rect x="790" y="280" width="400" height="155" fill="var(--color-surface)" stroke="var(--color-outline)"/><text x="814" y="320" fontWeight="700" fill="var(--color-on-surface)">解釈の焦点</text><text x="814" y="356">差が許容範囲内に収まるか</text><text x="814" y="388">測定値の大きさで差が変わるか</text><text x="814" y="420">一定の偏りが残るか</text>
      <text x="92" y="610" fontWeight="700" fill="var(--color-on-surface)">読み方</text><text x="92" y="642">平均差は系統的なずれ、一致限界は個々の差の広がりを示す。</text><text x="92" y="674">相関が高くても測定値が一致するとは限らない。許容幅は用途ごとに定める。</text>
    </svg>
    <table><thead><tr><th>対象</th><th>{d.methodA}</th><th>{d.methodB}</th><th>平均</th><th>差(B−A)</th></tr></thead><tbody>{d.pairs.map((p,i)=><tr key={p.id} data-agreement-pair={p.id}><td data-label="対象">{i+1} / {p.label}</td><td className="mono" data-label={d.methodA}>{fmt(p.valueA)}</td><td className="mono" data-label={d.methodB}>{fmt(p.valueB)}</td><td className="mono" data-label="平均">{fmt((p.valueA+p.valueB)/2)}</td><td className="mono" data-label="差">{fmt(p.valueB-p.valueA)}</td></tr>)}</tbody></table>
  </section>;
}
/designs/measurement-agreement/source/schema.ts
import { z } from "zod";

const text = z.string().trim().min(1).max(160);
const short = z.string().trim().min(1).max(64);
const value = z.number().finite();

export const schema = z.object({
  title: text.describe("測定法の一致性について伝える見出し"),
  subtitle: text.optional().describe("対象期間・標本条件・測定手順"),
  methodA: short.describe("比較の基準となる測定法"),
  methodB: short.describe("一致性を評価する測定法"),
  unit: short.describe("両測定法で共通する単位"),
  pairs: z.array(z.object({
    id: z.string().trim().min(1).max(24),
    label: short.describe("同一対象の識別名"),
    valueA: value.describe("測定法Aの観測値"),
    valueB: value.describe("同一対象における測定法Bの観測値"),
  }).strict()).min(4).max(12).describe("同一対象に対する対応のある測定値。4〜12組"),
}).strict().superRefine((data, ctx) => {
  if (data.methodA === data.methodB) ctx.addIssue({ code: "custom", path: ["methodB"], message: "測定法名は異なる必要がある" });
  if (new Set(data.pairs.map(pair => pair.id)).size !== data.pairs.length) {
    ctx.addIssue({ code: "custom", path: ["pairs"], message: "対応ペアIDは一意" });
  }
});

export type Props = z.infer<typeof schema>;
/designs/measurement-agreement/source/meta.yaml
id: measurement-agreement
name:
  ja: 対応測定の一致分析
  en: Paired Measurement Agreement
purpose:
  ja: 同一対象を測った2方式の差を平均値に対して表示し、系統差と95%一致限界を確認する。
  en: Plot paired method differences against pair means to inspect bias and 95% limits of agreement.
status: published
still: ./still.png
category: analysis
catalogOrder: 970
jobs:
  - prioritize-diagnose
  - measure-change
useCases:
  - prioritization
  - kpi
layoutKinds:
  - matrix
tags:
  - measurement-agreement
  - paired-data
  - offline
  - responsive
whenToUse:
  - ja: 同じ検体や対象を2つの測定方式で測り、方式を置き換えられるか調べる。
    en: Use paired observations to assess whether two measurement methods can be used interchangeably.
  - ja: 測定値の大きさに応じて差が広がるか、一定の偏りがあるか確認する。
    en: Inspect whether differences vary with magnitude or show a systematic bias.
avoidWhen:
  - ja: 2指標の相関や順位関係だけを見る場合は散布図を使う。相関は一致を示さない。
    en: Use a scatter plot for association; correlation alone does not establish agreement.
  - ja: 個体別対応のない集計値しかない場合は使わない。
    en: Do not use without paired measurements from the same subjects.
requiredInputs:
  - ja: 同じ対象に対する2方式の測定値を対応付ける。
    en: Pair the two method values for each same subject.
  - ja: 共通単位を指定する。平均差と標本標準偏差から一致限界を計算する。
    en: Provide a common unit; mean difference and sample standard deviation determine agreement limits.
relatedLayouts:
  - scatter-relationship
  - slope-change
dataSchema:
  title: string — 結論を伝える見出し
  subtitle: string? — 対象・測定条件
  methodA, methodB, unit: string — 異なる測定法と共通単位
  pairs: array (id, label, valueA, valueB) — 同一対象の対応測定4〜12組
sources: []
/designs/measurement-agreement/source/sample-data.json
{
  "title": "新旧の測定器は交換可能な範囲で一致しているか",
  "subtitle": "架空例|同じ12検体を同日に両方式で測定",
  "methodA": "基準測定器",
  "methodB": "携帯測定器",
  "unit": "mg/dL",
  "pairs": [
    { "id": "m01", "label": "検体01", "valueA": 72, "valueB": 74 },
    { "id": "m02", "label": "検体02", "valueA": 84, "valueB": 82 },
    { "id": "m03", "label": "検体03", "valueA": 91, "valueB": 95 },
    { "id": "m04", "label": "検体04", "valueA": 103, "valueB": 101 },
    { "id": "m05", "label": "検体05", "valueA": 117, "valueB": 120 },
    { "id": "m06", "label": "検体06", "valueA": 128, "valueB": 125 }
  ]
}