Seen as a design The generated document itself — its toggles and disclosures work here
Seen as a design The generated document itself — its toggles and disclosures work here
Copy and paste, or save a file and hand it over. For a machine with no network, one “Everything” file is enough.
Everything in this panel, including the contents behind each URL, in one Markdown file — Large, so it goes as a file (copy is for 32 KB and under)
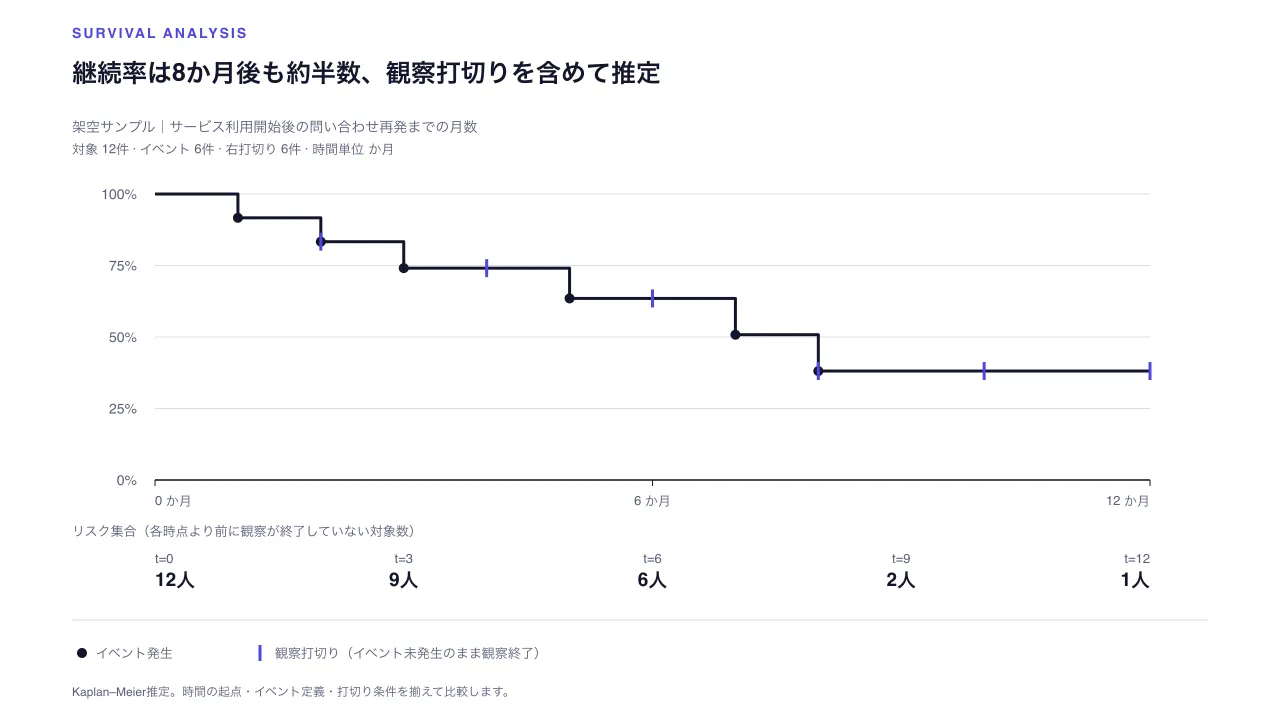
Build an HTML document with "Survival Curve with Censored Observations". This layout runs, so there is no composition to rebuild — what it needs is content.

## What this layout does
Estimate stepwise survival probability and the number at risk from individual event and right-censoring times.

## What you have to supply
- Provide each subject's observation time and event status; mark subjects event-free at cutoff as right-censored.
- Keep time origin, unit, event definition, and censoring rule consistent.

## The shape of the input
- `title` — string — 生存・継続の状況を伝える見出し
- `subtitle` — string? — 対象集団・観察期間・集計時点
- `timeUnit` — string — 観察時間の単位
- `subjects` — array (id, time, eventObserved) — 個体単位の観察データ。6〜64件、IDは48文字以内。falseは右打切り

schema.ts holds the machine-checkable validation. Ask rather than guess when an input is missing.

## When not to use it
- Use cohort retention when only aggregate period-by-period retention rates are available.
- Do not compare populations with materially different observation conditions without stating the differences.

## How to build it
Put the input in a JSON file and run:

```bash
node scripts/render.mjs survival-curve <input.json> --theme ink -o out.html
```

The output is one self-contained file and fetches nothing at render time.

## The source
- https://design-vault.pages.dev/designs/survival-curve/source/template.tsx
- https://design-vault.pages.dev/designs/survival-curve/source/schema.ts
- https://design-vault.pages.dev/designs/survival-curve/source/sample-data.json
- https://design-vault.pages.dev/designs/survival-curve/sample.html
Template, input schema, sample data and metadata. This document was generated from those four. The generated document
/designs/survival-curve/source/template.tsx
import type { Props } from "./schema";

const CSS = String.raw`
.asset{font-family:var(--font-sans);color:var(--color-on-surface);background:var(--color-surface);margin:0;line-height:1.5}
.asset .chart{display:block;width:1280px;height:720px;max-width:100%;margin:0 auto}
.asset .mobile{display:none;max-width:720px;margin:0 auto;padding:1.25rem 1rem}
.asset .mobile h1{font-size:1.5rem;line-height:1.35;overflow-wrap:anywhere}.asset .muted{color:var(--color-secondary)}
.asset details{max-width:1080px;margin:1rem auto;padding:.75rem 1rem;border-top:1px solid var(--color-outline)}
.asset summary{cursor:pointer;min-height:2.75rem;padding:.5rem 0;color:var(--color-secondary)}
.asset table{border-collapse:collapse;width:100%;font-variant-numeric:tabular-nums}.asset th,.asset td{text-align:left;padding:.6rem .75rem;border-bottom:1px solid var(--color-outline);overflow-wrap:anywhere}.asset th{color:var(--color-secondary)}
.asset ol{list-style:none;padding:0;margin:1rem 0}.asset li{padding:.75rem 0;border-top:1px solid var(--color-outline)}.asset .subject-id{font:600 .8rem var(--font-mono);color:var(--color-secondary)}
@media(max-width:640px){.asset .chart{display:none!important}.asset .mobile{display:block}.asset details{margin:.5rem 1rem;padding:.75rem 0}.asset table,.asset thead,.asset tbody,.asset tr,.asset td{display:block}.asset thead{display:none}.asset tr{padding:.5rem 0;border-bottom:1px solid var(--color-outline)}.asset td{display:grid;grid-template-columns:8rem minmax(0,1fr);gap:.75rem;border:0;padding:.2rem 0}.asset td:before{content:attr(data-label);font-size:.75rem;color:var(--color-secondary)}}
@media(min-width:641px){.asset .mobile{display:none!important}}
`;

const fmt = (n: number) => Number.isInteger(n) ? n.toLocaleString("ja-JP") : n.toLocaleString("ja-JP", { maximumFractionDigits: 1 });
const wrap = (value: string, size: number) => {
  const chars = [...value];
  const result: string[] = [];
  for (let i = 0; i < chars.length; i += size) result.push(chars.slice(i, i + size).join(""));
  return result.length ? result : [""];
};

export default function Template(d: Props) {
  const times = [...new Set(d.subjects.map(subject => subject.time))].sort((a, b) => a - b);
  let survival = 1;
  const groups = times.map(time => {
    const atRisk = d.subjects.filter(subject => subject.time >= time).length;
    const events = d.subjects.filter(subject => subject.time === time && subject.eventObserved).length;
    const censored = d.subjects.filter(subject => subject.time === time && !subject.eventObserved).length;
    const before = survival;
    if (events > 0) survival *= (atRisk - events) / atRisk;
    return { time, atRisk, events, censored, before, after: survival };
  });
  const maxTime = Math.max(...times);
  const titleLines = wrap(d.title, 45);
  const subtitleLines = wrap(d.subtitle ?? "", 78);
  const lastTitleY = 82 + (titleLines.length - 1) * 31;
  const lastSubtitleY = subtitleLines.length ? 101 + titleLines.length * 31 + (subtitleLines.length - 1) * 20 : lastTitleY;
  const metadataY = lastSubtitleY + 22;
  const plot = { left: 155, right: 1150, top: Math.max(190, metadataY + 40), bottom: 480 };
  const x = (time: number) => plot.left + (time / maxTime) * (plot.right - plot.left);
  const y = (rate: number) => plot.bottom - rate * (plot.bottom - plot.top);
  const stepPath = groups.reduce((path, group) =>
    `${path} L ${x(group.time).toFixed(2)} ${y(group.before).toFixed(2)} L ${x(group.time).toFixed(2)} ${y(group.after).toFixed(2)}`,
  `M ${plot.left} ${y(1)} L ${x(groups[0].time).toFixed(2)} ${y(1)}`);
  const eventTotal = d.subjects.filter(subject => subject.eventObserved).length;
  const censoredTotal = d.subjects.length - eventTotal;
  const atRiskTimes = [0, maxTime * .25, maxTime * .5, maxTime * .75, maxTime];
  const riskCounts = atRiskTimes.map(time => d.subjects.filter(subject => subject.time >= time).length);
  const roundedRiskTimes = atRiskTimes.map(time => Math.round(time * 10) / 10);
  const subjects = [...d.subjects].sort((a, b) => a.time - b.time || a.id.localeCompare(b.id, "ja"));

  return <section className="asset asset-survival-curve">
    <style>{CSS}</style>
    <svg className="chart" data-layout-still="true" width="1280" height="720" viewBox="0 0 1280 720" role="img" aria-labelledby="survival-title survival-desc">
      <title id="survival-title">{d.title}</title>
      <desc id="survival-desc">個体ごとのイベント発生と右打切りから推定した生存曲線。対象{d.subjects.length}件、イベント{eventTotal}件、打切り{censoredTotal}件。</desc>
      <rect x="0" y="0" width="1280" height="720" fill="var(--color-surface)" />
      <text x="72" y="38" fontFamily="sans-serif" fontSize="14" fontWeight="700" letterSpacing="2" fill="var(--color-tertiary)">SURVIVAL ANALYSIS</text>
      {titleLines.map((line, i) => <text key={`t${i}`} x="72" y={82 + i * 31} fontFamily="sans-serif" fontSize="25" fontWeight="700" fill="var(--color-on-surface)">{line}</text>)}
      {subtitleLines.map((line, i) => <text key={`s${i}`} x="72" y={101 + titleLines.length * 31 + i * 20} fontFamily="sans-serif" fontSize="14" fill="var(--color-secondary)">{line}</text>)}
      <text x="72" y={metadataY} fontFamily="sans-serif" fontSize="13" fill="var(--color-secondary)">対象 {d.subjects.length}件 · イベント {eventTotal}件 · 右打切り {censoredTotal}件 · 時間単位 {d.timeUnit}</text>
      {[0, .25, .5, .75, 1].map(rate => <g key={rate}>
        <line x1={plot.left} x2={plot.right} y1={y(rate)} y2={y(rate)} stroke="var(--color-outline)" strokeWidth="1" />
        <text x="137" y={y(rate) + 5} textAnchor="end" fontFamily="sans-serif" fontSize="14" fill="var(--color-secondary)">{Math.round(rate * 100)}%</text>
      </g>)}
      <path d={stepPath} fill="none" stroke="var(--color-on-surface)" strokeWidth="3" strokeLinejoin="round" />
      {groups.filter(group => group.events > 0).map(group => <circle key={`event-${group.time}`} cx={x(group.time)} cy={y(group.after)} r="5" fill="var(--color-on-surface)" />)}
      {groups.filter(group => group.censored > 0).map(group => <g key={`censor-${group.time}`} data-censor-count={group.censored}>
        <line x1={x(group.time)} x2={x(group.time)} y1={y(group.after) - 9} y2={y(group.after) + 9} stroke="var(--color-tertiary)" strokeWidth="3" />
        {group.censored > 1 && <text x={x(group.time) + 7} y={y(group.after) - 7} fontFamily="sans-serif" fontSize="11" fill="var(--color-tertiary)">×{group.censored}</text>}
      </g>)}
      <line x1={plot.left} x2={plot.right} y1={plot.bottom} y2={plot.bottom} stroke="var(--color-on-surface)" strokeWidth="1.5" />
      {[0, maxTime / 2, maxTime].map((time, i) => <g key={i}>
        <line x1={x(time)} x2={x(time)} y1={plot.bottom} y2={plot.bottom + 6} stroke="var(--color-on-surface)" />
        <text x={x(time)} y={plot.bottom + 25} textAnchor={i === 0 ? "start" : i === 2 ? "end" : "middle"} fontFamily="sans-serif" fontSize="13" fill="var(--color-secondary)">{fmt(time)} {d.timeUnit}</text>
      </g>)}
      <text x="72" y="536" fontFamily="sans-serif" fontSize="13" fill="var(--color-secondary)">リスク集合(各時点より前に観察が終了していない対象数)</text>
      {roundedRiskTimes.map((time, i) => <g key={`risk-${i}`}>
        <text x={plot.left + i * (plot.right - plot.left) / 4} y="563" textAnchor={i === 0 ? "start" : i === 4 ? "end" : "middle"} fontFamily="sans-serif" fontSize="13" fill="var(--color-secondary)">t={fmt(time)}</text>
        <text x={plot.left + i * (plot.right - plot.left) / 4} y="586" textAnchor={i === 0 ? "start" : i === 4 ? "end" : "middle"} fontFamily="sans-serif" fontSize="19" fontWeight="700" fill="var(--color-on-surface)">{riskCounts[i]}人</text>
      </g>)}
      <line x1="72" x2="1208" y1="620" y2="620" stroke="var(--color-outline)" />
      <circle cx="82" cy="653" r="5" fill="var(--color-on-surface)" />
      <text x="96" y="658" fontFamily="sans-serif" fontSize="13" fill="var(--color-secondary)">イベント発生</text>
      <line x1="260" x2="260" y1="645" y2="661" stroke="var(--color-tertiary)" strokeWidth="3" />
      <text x="275" y="658" fontFamily="sans-serif" fontSize="13" fill="var(--color-secondary)">観察打切り(イベント未発生のまま観察終了)</text>
      <text x="72" y="696" fontFamily="sans-serif" fontSize="12" fill="var(--color-secondary)">Kaplan–Meier推定。時間の起点・イベント定義・打切り条件を揃えて比較します。</text>
    </svg>

    <div className="mobile">
      <p className="muted">SURVIVAL ANALYSIS · {d.subjects.length}件</p>
      <h1>{d.title}</h1>
      {d.subtitle && <p className="muted">{d.subtitle}</p>}
      <p>イベント {eventTotal}件 · 右打切り {censoredTotal}件</p>
      <p>横軸: 観察時間({d.timeUnit}) · 縦軸: イベント未発生の推定割合</p>
      <ol>{subjects.map(subject => <li key={subject.id} data-subject-id={subject.id}>
        <span className="subject-id">{subject.id}</span>
        <div>{fmt(subject.time)} {d.timeUnit}</div>
        <div>{subject.eventObserved ? "イベント発生" : "右打切り・観察終了時までイベント未発生"}</div>
      </li>)}</ol>
    </div>
    <details open><summary>対象ごとの観察データと推定手順</summary><table>
      <thead><tr><th scope="col">対象ID</th><th scope="col">観察時間({d.timeUnit})</th><th scope="col">状態</th></tr></thead>
      <tbody>{subjects.map(subject => <tr key={subject.id} data-subject-id={subject.id}>
        <td data-label="対象ID">{subject.id}</td><td data-label="観察時間">{fmt(subject.time)}</td>
        <td data-label="状態">{subject.eventObserved ? "イベント発生" : "右打切り・観察終了時までイベント未発生"}</td>
      </tr>)}</tbody>
    </table><p className="muted">各イベント時点で、観察中の対象数に対するイベント数を用いて生存割合を更新します。打切り対象は打切り時点まではリスク集合に含み、その後の時点から除きます。</p></details>
  </section>;
}
/designs/survival-curve/source/schema.ts
import { z } from "zod";

const text = z.string().trim().min(1).max(160);
const short = z.string().trim().min(1).max(24);
const subjectId = z.string().trim().min(1).max(48);
const unique = (values: string[]) => new Set(values).size === values.length;

export const schema = z.object({
  title: text.describe("生存・継続の状況を伝える見出し"),
  subtitle: text.optional().describe("対象集団・観察期間・集計時点"),
  timeUnit: short.describe("観察時間の単位"),
  subjects: z.array(z.object({
    id: subjectId.describe("対象者または対象の一意な識別子"),
    time: z.number().finite().positive().max(36500).describe("イベント発生または打切りまでの観察時間"),
    eventObserved: z.boolean().describe("イベント発生が観測されたか。falseは右打切り"),
  }).strict()).min(6).max(64).describe("個体単位のイベント・右打切り観測"),
}).strict().refine(data => unique(data.subjects.map(subject => subject.id)), "対象IDは一意").refine(
  data => data.subjects.some(subject => subject.eventObserved),
  "生存率を推定するには観測されたイベントが1件以上必要",
);

export type Props = z.infer<typeof schema>;
/designs/survival-curve/source/meta.yaml
id: survival-curve
name:
  ja: 打切りを含む生存曲線
  en: Survival Curve with Censored Observations
purpose:
  ja: 個体ごとのイベント発生または観察打切りまでの時間から、生存確率の段階推定と各時点のリスク集合を示す。
  en: Estimate stepwise survival probability and the number at risk from individual event and right-censoring times.
status: published
still: ./still.png
category: analysis
catalogOrder: 780
jobs:
  - measure-change
  - compare-choose
useCases:
  - kpi
  - comparison
layoutKinds:
  - timeline
tags:
  - survival-analysis
  - kaplan-meier
  - right-censoring
  - offline
  - responsive
whenToUse:
  - ja: 観察終了時点までイベントが起きていない対象も含め、イベントまでの時間と生存確率を比較する。
    en: Use to compare time to event and survival probability when some subjects have not had the event by the observation cutoff.
  - ja: 再発、解約、故障など「いつ起きたか」と未発生の観察打切りを同じ解析に含める。
    en: Use for recurrence, churn, or failure where event times and right-censored observations must coexist.
avoidWhen:
  - ja: 個体別の時間とイベント状態がなく、集計済みの期間別継続率だけがある場合はコホート継続率を使う。
    en: Use cohort retention when only aggregate period-by-period retention rates are available.
  - ja: 観察条件の異なる集団を、比較条件を揃えずに並べる場合。
    en: Do not compare populations with materially different observation conditions without stating the differences.
requiredInputs:
  - ja: 各対象の観察時間とイベント発生有無を指定する。未発生で観察終了した対象は右打切りとして記録する。
    en: Provide each subject's observation time and event status; mark subjects event-free at cutoff as right-censored.
  - ja: 時間の起点・単位・イベント定義・観察打切り条件を揃える。
    en: Keep time origin, unit, event definition, and censoring rule consistent.
relatedLayouts:
  - cohort-retention
  - line-trend
dataSchema:
  title: string — 生存・継続の状況を伝える見出し
  subtitle: string? — 対象集団・観察期間・集計時点
  timeUnit: string — 観察時間の単位
  subjects: array (id, time, eventObserved) — 個体単位の観察データ。6〜64件、IDは48文字以内。falseは右打切り
sources: []
/designs/survival-curve/source/sample-data.json
{
  "title": "継続率は8か月後も約半数、観察打切りを含めて推定",
  "subtitle": "架空サンプル|サービス利用開始後の問い合わせ再発までの月数",
  "timeUnit": "か月",
  "subjects": [
    { "id": "case-001", "time": 1, "eventObserved": true },
    { "id": "case-002", "time": 2, "eventObserved": true },
    { "id": "case-003", "time": 2, "eventObserved": false },
    { "id": "case-004", "time": 3, "eventObserved": true },
    { "id": "case-005", "time": 4, "eventObserved": false },
    { "id": "case-006", "time": 5, "eventObserved": true },
    { "id": "case-007", "time": 6, "eventObserved": false },
    { "id": "case-008", "time": 7, "eventObserved": true },
    { "id": "case-009", "time": 8, "eventObserved": true },
    { "id": "case-010", "time": 8, "eventObserved": false },
    { "id": "case-011", "time": 10, "eventObserved": false },
    { "id": "case-012", "time": 12, "eventObserved": false }
  ]
}