Seen as a design The generated document itself — its toggles and disclosures work here
Seen as a design The generated document itself — its toggles and disclosures work here
Copy and paste, or save a file and hand it over. For a machine with no network, one “Everything” file is enough.
Everything in this panel, including the contents behind each URL, in one Markdown file — Large, so it goes as a file (copy is for 32 KB and under)
Build an HTML document with "Tornado Sensitivity Analysis". This layout runs, so there is no composition to rebuild — what it needs is content.

## What this layout does
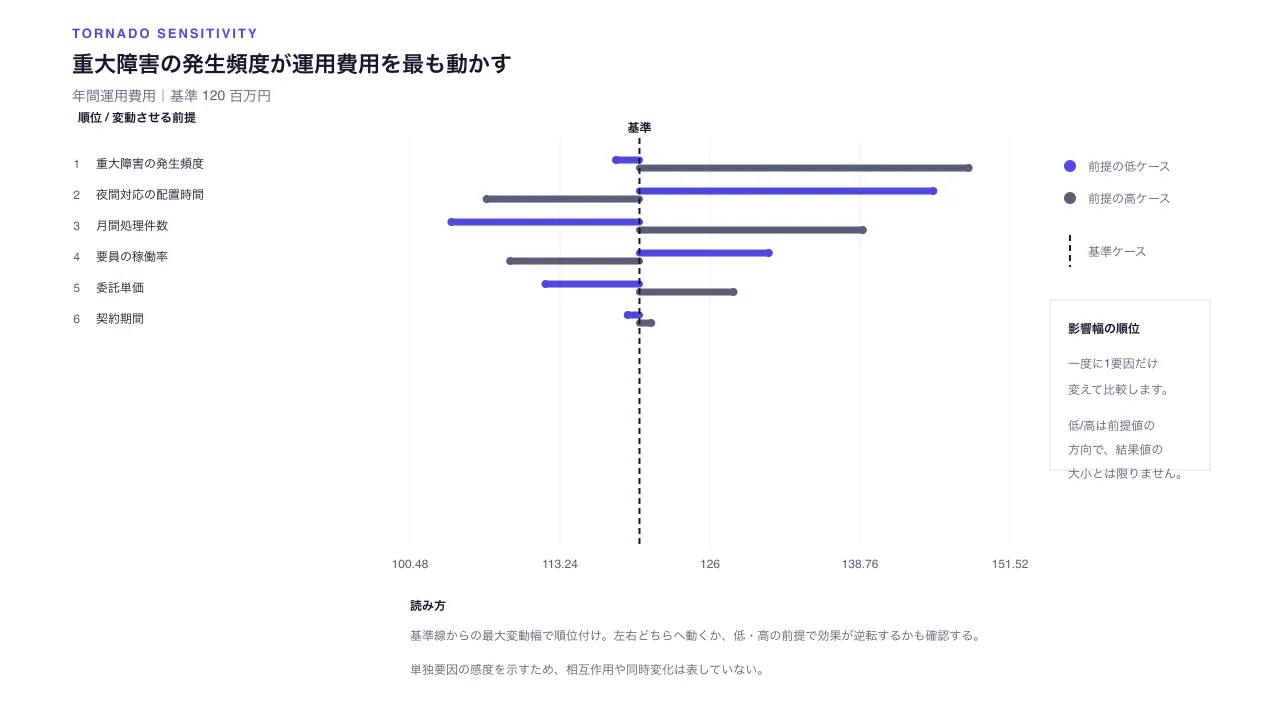
Rank one-at-a-time low and high assumption scenarios against a base case to reveal the largest drivers and directions of change.

## What you have to supply
- Supply one result label and unit with a base-case output.
- For four to twelve assumptions, provide resulting outputs when only that assumption is low or high; scenario direction need not match output direction.

## The shape of the input
- `title` — string — 影響の大きい前提を伝える見出し
- `subtitle` — string? — モデル・期間・他の固定条件
- `resultLabel` — string — 比較するモデル出力の名前
- `unit` — string — モデル出力の単位
- `baseCase` — number — 全前提を基準値に置いたときのモデル出力
- `factors` — array (id, label, lowAssumptionOutcome, highAssumptionOutcome) — 4〜12前提。低・高ケースはそれぞれ一要因だけ変えたモデル出力

schema.ts holds the machine-checkable validation. Ask rather than guess when an input is missing.

## When not to use it
- Use a forecast band for several future paths distributed across time.
- Do not use for joint changes, probability distributions, or interactions; every other assumption stays at the base case.

## How to build it
Put the input in a JSON file and run:

```bash
node scripts/render.mjs tornado-sensitivity <input.json> --theme ink -o out.html
```

The output is one self-contained file and fetches nothing at render time.

## The source
- https://design-vault.pages.dev/designs/tornado-sensitivity/source/template.tsx
- https://design-vault.pages.dev/designs/tornado-sensitivity/source/schema.ts
- https://design-vault.pages.dev/designs/tornado-sensitivity/source/sample-data.json
- https://design-vault.pages.dev/designs/tornado-sensitivity/sample.html
Template, input schema, sample data and metadata. This document was generated from those four. The generated document
/designs/tornado-sensitivity/source/template.tsx
import type { Props } from "./schema";

const CSS = String.raw`
.asset{font-family:var(--font-sans);color:var(--color-on-surface);background:var(--color-surface);max-width:var(--container-slide);margin:auto;padding:2.5rem 3rem;line-height:1.5}.asset *{box-sizing:border-box}.asset h1{font-size:var(--text-h1);line-height:1.3;margin:0}.asset .subtitle{color:var(--color-secondary);margin:.6rem 0 1.25rem}.asset .eyebrow{font:600 var(--text-label) var(--font-mono);letter-spacing:.1em;color:var(--color-tertiary)}.asset .plot{display:block;width:100%;height:auto}.asset .plot text{font-family:var(--font-sans);font-size:13px;fill:var(--color-secondary)}.asset .plot .ink{fill:var(--color-on-surface)}.asset .summary{display:grid;grid-template-columns:repeat(3,minmax(0,1fr));gap:1rem;margin:1rem 0 1.5rem}.asset .metric{padding:1rem;background:var(--color-surface-subtle);border-top:3px solid var(--color-tertiary);min-width:0}.asset .metric dt{font-size:var(--text-label);color:var(--color-secondary)}.asset .metric dd{margin:.25rem 0 0;font:700 var(--text-h2) var(--font-mono);overflow-wrap:anywhere}.asset .legend{display:flex;gap:1.5rem;flex-wrap:wrap;margin:.75rem 0;color:var(--color-secondary);font-size:var(--text-label)}.asset .legend i{display:inline-block;width:.75rem;height:.75rem;margin-right:.45rem;border-radius:50%;background:var(--color-tertiary)}.asset .legend .high{background:var(--color-secondary)}.asset .ledger{border-collapse:collapse;width:100%;font-variant-numeric:tabular-nums}.asset .ledger th,.asset .ledger td{text-align:left;vertical-align:top;padding:.65rem .75rem;border-bottom:1px solid var(--color-outline);overflow-wrap:anywhere}.asset .ledger th{color:var(--color-secondary)}.asset .ledger .mono{font-family:var(--font-mono)}.asset details{margin-top:1rem}.asset summary{cursor:pointer;min-height:2.75rem;padding:.5rem 0;color:var(--color-secondary)}.asset .note{border-left:3px solid var(--color-outline);padding:.75rem 1rem;color:var(--color-secondary)}
@media(max-width:640px){.asset{padding:1.5rem 1rem}.asset .plot{display:none}.asset h1{font-size:var(--text-h2)}.asset .summary{grid-template-columns:1fr}.asset .ledger,.asset .ledger tbody,.asset .ledger tr,.asset .ledger td{display:block}.asset .ledger thead{display:none}.asset .ledger tr{padding:.65rem 0;border-bottom:1px solid var(--color-outline)}.asset .ledger td{display:grid;grid-template-columns:9rem minmax(0,1fr);gap:.75rem;border:0;padding:.2rem 0}.asset .ledger td:before{content:attr(data-label);font-size:var(--text-label);color:var(--color-secondary)}}
`;

type Factor = Props["factors"][number];
const fmt = (value: number) => Number.isInteger(value) ? value.toLocaleString("ja-JP") : value.toLocaleString("ja-JP", { maximumFractionDigits: 2 });
const impact = (factor: Factor, base: number) => Math.max(Math.abs(factor.lowAssumptionOutcome - base), Math.abs(factor.highAssumptionOutcome - base));
const shorten = (value: string, max = 24) => [...value].length > max ? [...value].slice(0, max - 1).join("") + "…" : value;

export default function Template(d: Props) {
  const sorted = [...d.factors].sort((a, b) => impact(b, d.baseCase) - impact(a, d.baseCase));
  const allValues = [d.baseCase, ...d.factors.flatMap(factor => [factor.lowAssumptionOutcome, factor.highAssumptionOutcome])];
  const rawMin = Math.min(...allValues), rawMax = Math.max(...allValues);
  const pad = (rawMax - rawMin || Math.max(Math.abs(d.baseCase), 1)) * .08;
  const min = rawMin - pad, max = rawMax + pad;
  const plotLeft = 410, plotRight = 1010;
  const xAt = (value: number) => plotLeft + (value - min) / (max - min) * (plotRight - plotLeft);
  const baseX = xAt(d.baseCase);
  const tickValues = [0, .25, .5, .75, 1].map(t => min + t * (max - min));
  return <section className="asset asset-tornado-sensitivity">
    <style>{CSS}</style>
    <header>
      <p className="eyebrow">TORNADO SENSITIVITY / ONE-AT-A-TIME SCENARIOS</p>
      <h1>{d.title}</h1>
      {d.subtitle && <p className="subtitle">{d.subtitle}</p>}
    </header>
    <svg className="plot" data-layout-still="true" width="1280" height="720" viewBox="0 0 1280 720" role="img" aria-labelledby="tornado-title tornado-desc" fontFamily="sans-serif" fontSize="12" fill="var(--color-secondary)">
      <title id="tornado-title">{d.title}</title>
      <desc id="tornado-desc">基準ケース {fmt(d.baseCase)} {d.unit} から、前提を一つずつ低ケース・高ケースへ動かした結果を影響幅の大きい順に示す。各結果は他の前提を基準に固定した感度分析。</desc>
      <rect x="0" y="0" width="1280" height="720" fill="var(--color-surface)" />
      <text x="72" y="38" fontSize="13" fontWeight="700" letterSpacing="2" fill="var(--color-tertiary)">TORNADO SENSITIVITY</text>
      <text x="72" y="72" fontSize="22" fontWeight="700" fill="var(--color-on-surface)">{d.title}</text>
      <text x="72" y="101" fontSize="14" fill="var(--color-secondary)">{d.resultLabel}|基準 {fmt(d.baseCase)} {d.unit}</text>
      <text x="78" y="122" fontWeight="700" fill="var(--color-on-surface)">順位 / 変動させる前提</text>
      {tickValues.map((value, index) => {
        const x = plotLeft + index * (plotRight - plotLeft) / 4;
        return <g key={index}>
          <line x1={x} y1="138" x2={x} y2="545" stroke="var(--color-outline)" strokeWidth="1" opacity=".5" />
          <text x={x} y="568" textAnchor="middle">{fmt(value)}</text>
        </g>;
      })}
      {sorted.map((factor, index) => {
        const y = 164 + index * 31;
        return <g key={factor.id} data-tornado-factor={factor.id}>
          <text x="80" y={y + 4} textAnchor="end">{index + 1}</text>
          <text x="96" y={y + 4} fill="var(--color-on-surface)">{shorten(factor.label)}</text>
          <line x1={baseX} y1={y - 4} x2={xAt(factor.lowAssumptionOutcome)} y2={y - 4} stroke="var(--color-tertiary)" strokeWidth="7" strokeLinecap="round" />
          <circle cx={xAt(factor.lowAssumptionOutcome)} cy={y - 4} r="4" fill="var(--color-tertiary)" />
          <line x1={baseX} y1={y + 4} x2={xAt(factor.highAssumptionOutcome)} y2={y + 4} stroke="var(--color-secondary)" strokeWidth="7" strokeLinecap="round" />
          <circle cx={xAt(factor.highAssumptionOutcome)} cy={y + 4} r="4" fill="var(--color-secondary)" />
        </g>;
      })}
      <line x1={baseX} y1="138" x2={baseX} y2="545" stroke="var(--color-on-surface)" strokeWidth="2" strokeDasharray="6 4" />
      <text x={baseX} y="132" textAnchor="middle" fontWeight="700" fill="var(--color-on-surface)">基準</text>
      <circle cx="1070" cy="166" r="6" fill="var(--color-tertiary)" />
      <text x="1088" y="171">前提の低ケース</text>
      <circle cx="1070" cy="198" r="6" fill="var(--color-secondary)" />
      <text x="1088" y="203">前提の高ケース</text>
      <line x1="1070" y1="235" x2="1070" y2="267" stroke="var(--color-on-surface)" strokeWidth="2" strokeDasharray="6 4" />
      <text x="1088" y="256">基準ケース</text>
      <rect x="1050" y="300" width="160" height="170" fill="var(--color-surface)" stroke="var(--color-outline)" />
      <text x="1068" y="333" fontWeight="700" fill="var(--color-on-surface)">影響幅の順位</text>
      <text x="1068" y="368">一度に1要因だけ</text>
      <text x="1068" y="394">変えて比較します。</text>
      <text x="1068" y="430">低/高は前提値の</text>
      <text x="1068" y="454">方向で、結果値の</text>
      <text x="1068" y="478">大小とは限りません。</text>
      <text x="410" y="610" fontWeight="700" fill="var(--color-on-surface)">読み方</text>
      <text x="410" y="640">基準線からの最大変動幅で順位付け。左右どちらへ動くか、低・高の前提で効果が逆転するかも確認する。</text>
      <text x="410" y="674">単独要因の感度を示すため、相互作用や同時変化は表していない。</text>
    </svg>
    <dl className="summary">
      <div className="metric"><dt>基準ケース|{d.resultLabel}</dt><dd>{fmt(d.baseCase)} {d.unit}</dd></div>
      <div className="metric"><dt>最大の影響要因</dt><dd>{sorted[0].label}</dd></div>
      <div className="metric"><dt>比較要因数</dt><dd>{d.factors.length}</dd></div>
    </dl>
    <p className="note">低ケース・高ケースは前提値の方向を表し、結果の大小を保証しません。他要因を基準に固定した一要因感度なので、相互作用や同時変動は別途評価してください。</p>
    <details open>
      <summary>全要因とシナリオ出力を確認({d.factors.length}要因)</summary>
      <table className="ledger"><thead><tr><th>順位 / 前提要因</th><th>低ケースの出力</th><th>高ケースの出力</th><th>最大変動幅</th></tr></thead>
        <tbody>{sorted.map((factor, index) => <tr key={factor.id} data-tornado-factor={factor.id}>
          <td data-label="前提要因">{index + 1} / {factor.label}</td>
          <td data-label="低ケースの出力" className="mono">{fmt(factor.lowAssumptionOutcome)} {d.unit}</td>
          <td data-label="高ケースの出力" className="mono">{fmt(factor.highAssumptionOutcome)} {d.unit}</td>
          <td data-label="最大変動幅" className="mono">±{fmt(impact(factor, d.baseCase))} {d.unit}</td>
        </tr>)}</tbody>
      </table>
    </details>
  </section>;
}
/designs/tornado-sensitivity/source/schema.ts
import { z } from "zod";

const text = z.string().trim().min(1).max(160);
const id = z.string().trim().min(1).max(24);
const label = z.string().trim().min(1).max(64);
const value = z.number().finite();

export const schema = z.object({
  title: text.describe("どの前提が結果へ強く影響するかを伝える見出し"),
  subtitle: text.optional().describe("モデル・期間・他の固定条件"),
  resultLabel: label.describe("比較するモデル出力の名前"),
  unit: z.string().trim().min(1).max(24).describe("モデル出力の単位"),
  baseCase: value.describe("全前提を基準値に置いたときのモデル出力"),
  factors: z.array(z.object({
    id: id.describe("感度要因の一意なID"),
    label: label.describe("一度に一つずつ変化させるモデル前提"),
    lowAssumptionOutcome: value.describe("この前提を低ケースへ動かし他を基準に固定したモデル出力"),
    highAssumptionOutcome: value.describe("この前提を高ケースへ動かし他を基準に固定したモデル出力"),
  }).strict()).min(4).max(12).describe("基準ケースと比較する4〜12個の前提感度"),
}).strict().superRefine((data, ctx) => {
  const ids = data.factors.map(factor => factor.id);
  if (new Set(ids).size !== ids.length) {
    ctx.addIssue({ code: "custom", path: ["factors"], message: "感度要因IDは一意" });
  }
  data.factors.forEach((factor, index) => {
    if (factor.lowAssumptionOutcome === factor.highAssumptionOutcome) {
      ctx.addIssue({ code: "custom", path: ["factors", index], message: "低ケースと高ケースのモデル出力に差を持たせる" });
    }
  });
});

export type Props = z.infer<typeof schema>;
/designs/tornado-sensitivity/source/meta.yaml
id: tornado-sensitivity
name:
  ja: トルネード感度分析
  en: Tornado Sensitivity Analysis
purpose:
  ja: 基準ケースに対して前提を一つずつ低ケース・高ケースへ動かした出力を影響幅順に並べ、結果の主要ドライバーと変動方向を示す。
  en: Rank one-at-a-time low and high assumption scenarios against a base case to reveal the largest drivers and directions of change.
status: published
still: ./still.png
category: analysis
catalogOrder: 820
jobs:
  - prioritize-diagnose
  - measure-change
useCases:
  - prioritization
  - kpi
layoutKinds:
  - axis
tags:
  - tornado-sensitivity
  - scenario-analysis
  - assumption-testing
  - offline
  - responsive
whenToUse:
  - ja: 予測や事業計画の結果を大きく動かす入力前提を、基準ケースからの変化幅で順位付けする。
    en: Use to rank the input assumptions that move a forecast or business plan furthest from its base case.
  - ja: 各前提の低・高シナリオが出力をどちらへ動かすか、影響の非対称性も含めて説明する。
    en: Use to show whether low and high scenarios move the output in different directions or by asymmetric amounts.
avoidWhen:
  - ja: 期間に沿った複数将来経路を帯で示す場合は予測シナリオ帯を使う。
    en: Use a forecast band for several future paths distributed across time.
  - ja: 前提の同時変化、確率分布、相互作用を評価する場合。これは他の前提を基準に固定する一要因感度分析。
    en: Do not use for joint changes, probability distributions, or interactions; every other assumption stays at the base case.
requiredInputs:
  - ja: 共通の出力名・単位・基準ケースを指定する。
    en: Supply one result label and unit with a base-case output.
  - ja: 4〜12前提について、他条件を基準値に固定した前提低ケース・高ケースそれぞれの出力を入れる。ケース方向と出力大小は一致しなくてよい。
    en: For four to twelve assumptions, provide resulting outputs when only that assumption is low or high; scenario direction need not match output direction.
relatedLayouts:
  - forecast-band
  - ranked-bar-comparison
  - dumbbell-gap
dataSchema:
  title: string — 影響の大きい前提を伝える見出し
  subtitle: string? — モデル・期間・他の固定条件
  resultLabel: string — 比較するモデル出力の名前
  unit: string — モデル出力の単位
  baseCase: number — 全前提を基準値に置いたときのモデル出力
  factors: array (id, label, lowAssumptionOutcome, highAssumptionOutcome) — 4〜12前提。低・高ケースはそれぞれ一要因だけ変えたモデル出力
sources: []
/designs/tornado-sensitivity/source/sample-data.json
{
  "title": "重大障害の発生頻度が運用費用を最も動かす",
  "subtitle": "架空サンプル|次年度の委託運用費用を一要因ずつ変化",
  "resultLabel": "年間運用費用",
  "unit": "百万円",
  "baseCase": 120,
  "factors": [
    { "id": "f-volume", "label": "月間処理件数", "lowAssumptionOutcome": 104, "highAssumptionOutcome": 139 },
    { "id": "f-price", "label": "委託単価", "lowAssumptionOutcome": 112, "highAssumptionOutcome": 128 },
    { "id": "f-night", "label": "夜間対応の配置時間", "lowAssumptionOutcome": 145, "highAssumptionOutcome": 107 },
    { "id": "f-incident", "label": "重大障害の発生頻度", "lowAssumptionOutcome": 118, "highAssumptionOutcome": 148 },
    { "id": "f-utilization", "label": "要員の稼働率", "lowAssumptionOutcome": 131, "highAssumptionOutcome": 109 },
    { "id": "f-term", "label": "契約期間", "lowAssumptionOutcome": 119, "highAssumptionOutcome": 121 }
  ]
}