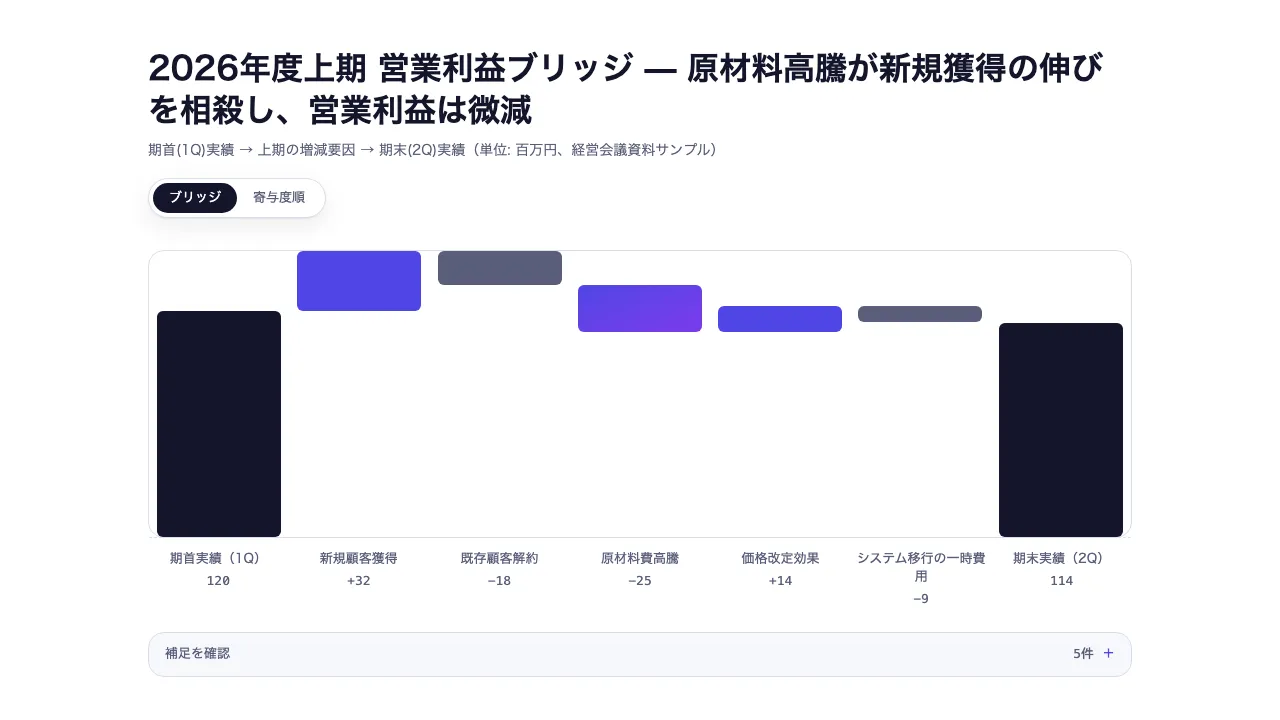
Seen as a design The generated document itself — its toggles and disclosures work here
Seen as a design The generated document itself — its toggles and disclosures work here
Copy and paste, or save a file and hand it over. For a machine with no network, one “Everything” file is enough.
Everything in this panel, including the contents behind each URL, in one Markdown file — Large, so it goes as a file (copy is for 32 KB and under)
Build an HTML document with "Waterfall Chart (Change Bridge)". This layout runs, so there is no composition to rebuild — what it needs is content.

## What this layout does
The factors between a start and an end as stacked bars. The same data also switches to a ranking by contribution, which is what distinguishes it from a chart tool's built-in bridge

## What you have to supply
- The start and end values
- The difference each factor makes
- A note on each factor

## The shape of the input
- `title` — string — スライドタイトル。結論を書くメッセージラインを推奨
- `subtitle` — string(任意)— 補足・出典など
- `steps` — { label, value, isTotal?, note?, highlight? } の配列。4〜7件が読みやすい(起点・終点を含む)
- `steps[].value` — number — isTotal: true なら累計の絶対値(起点・終点・中間集計のアンカー)。false/省略なら直前の累計に加算される差分(正=増加、負=減少)
- `steps[].isTotal` — boolean(任意)— true なら累計のリセット地点(primary色の構造バー)。省略時は差分(増加=tertiary/減少=secondary)
- `steps[].note` — string(任意)— 図の下の補足欄で明示的に展開される詳細(要因・前提・出典)
- `steps[].highlight` — boolean(任意)— 最重要の1件のみ true。isTotal のステップに付けると寄与度順ビューでは除外され消えるため、差分ステップに付けること(スキーマが拒否する)

schema.ts holds the machine-checkable validation. Ask rather than guess when an input is missing.

## When not to use it
- A single population narrowing stage by stage
- Listing several indicators against their targets

## How to build it
Put the input in a JSON file and run:

```bash
node scripts/render.mjs waterfall <input.json> --theme ink -o out.html
```

The output is one self-contained file and fetches nothing at render time.

## The source
- https://design-vault.pages.dev/designs/waterfall/source/template.tsx
- https://design-vault.pages.dev/designs/waterfall/source/schema.ts
- https://design-vault.pages.dev/designs/waterfall/source/sample-data.json
- https://design-vault.pages.dev/designs/waterfall/sample.html Template, input schema, sample data and metadata. This document was generated from those four. The generated document
/designs/waterfall/source/template.tsx
import { useId } from "react";
import type { WaterfallProps } from "./schema";

/** エントランスの時差。間隔は global.css の --stagger-step で統一 */
const stagger = (i: number, baseMs = 0) =>
  `calc(${baseMs}ms + ${i} * var(--stagger-step))`;

type StepInput = { value: number; isTotal?: boolean };
export type BridgeBar = { start: number; end: number; isTotal: boolean };

/**
 * 累計を各ステップの棒に写す。isTotal はその値を累計のリセット地点にする
 * (位置は schema で強制しないため、途中にある isTotal は中間小計として自然に働く)
 */
export function bridgeBars(steps: StepInput[]): BridgeBar[] {
  let acc = 0;
  return steps.map((s) => {
    if (s.isTotal) {
      acc = s.value;
      return { start: 0, end: s.value, isTotal: true };
    }
    const start = acc;
    acc += s.value;
    return { start, end: acc, isTotal: false };
  });
}

/**
 * 値域は必ず0を含める。total バーは「0からの高さ」で描く決定(構造バー)と
 * 整合させるため — 0を含めないと value と表示高さのスケールが食い違う
 */
export function chartDomain(bars: BridgeBar[]) {
  const values = bars.flatMap((b) => [b.start, b.end]);
  const min = Math.min(0, ...values);
  const max = Math.max(0, ...values);
  return { min, max, span: max - min };
}

export function zeroLinePct(domain: { max: number; span: number }): number {
  return domain.span === 0 ? 100 : (domain.max / domain.span) * 100;
}

/** span=0(空配列・全ゼロ)でも0除算しない。0ラインの位置を高さ0のバーとして返す */
export function barGeometry(
  bar: BridgeBar,
  domain: { max: number; span: number },
): { topPct: number; heightPct: number } {
  if (domain.span === 0) return { topPct: zeroLinePct(domain), heightPct: 0 };
  const top = domain.max - Math.max(bar.start, bar.end);
  const height = Math.abs(bar.end - bar.start);
  return { topPct: (top / domain.span) * 100, heightPct: (height / domain.span) * 100 };
}

/** 寄与度%の分母。total(アンカー)は「増減」ではないので除外する */
export function totalSwing(steps: StepInput[]): number {
  return steps.filter((s) => !s.isTotal).reduce((sum, s) => sum + Math.abs(s.value), 0);
}

/** swing=0(差分が全部0、または差分ステップが無い)は0を返す(NaN/Infinity禁止) */
export function contributionPct(value: number, swing: number): number {
  return swing === 0 ? 0 : (Math.abs(value) / swing) * 100;
}

/**
 * 寄与度順ビュー用の並べ替え。total は除外。originalIndex は安定したキーとして残す
 */
export function rankedSteps<T extends StepInput>(
  steps: T[],
): (T & { originalIndex: number })[] {
  return steps
    .map((s, originalIndex) => ({ ...s, originalIndex }))
    .filter((s) => !s.isTotal)
    .sort((a, b) => Math.abs(b.value) - Math.abs(a.value));
}

const HIGHLIGHT_GRADIENT = "bg-linear-to-br from-tertiary to-accent-violet";

/**
 * 色は「意味」でなく「構造/向き」を表す — total=primary(構造)、増加=tertiary、
 * 減少=secondary。success/error は良し悪し専用(DESIGN.md)なのでここでは使わない
 */
export function barColorClass(step: {
  isTotal?: boolean;
  value: number;
  highlight?: boolean;
}): string {
  if (step.highlight) return HIGHLIGHT_GRADIENT;
  if (step.isTotal) return "bg-primary";
  if (step.value > 0) return "bg-tertiary";
  if (step.value < 0) return "bg-secondary";
  return "bg-secondary/40";
}

/** 描画専用の最小可視表示。生のgeometry/%は汚さない(process-flow の stepWidths と同じ発想) */
export const MIN_VISIBLE_PCT = 0.6;
export const visiblePct = (pct: number) => Math.max(pct, MIN_VISIBLE_PCT);

/** 差分値の符号付き表示。ブリッジと寄与度順の両方で使う */
const signedValue = (value: number) => `${value > 0 ? "+" : ""}${value}`;

export default function Waterfall({
  title,
  subtitle,
  steps,
  instanceId,
}: WaterfallProps) {
  const autoId = useId();
  const uid = instanceId ?? autoId;

  const bars = bridgeBars(steps);
  const domain = chartDomain(bars);
  const swing = totalSwing(steps);
  const ranked = rankedSteps(steps);
  const zero = zeroLinePct(domain);
  const notes = steps.filter((step) => step.note);

  return (
    <section
      data-waterfall-root="true"
      className="group/waterfall mx-auto max-w-slide bg-surface p-12 font-sans text-on-surface"
    >
      {/* 表示切替は CSS のみ(radio + :has())。成果物の単一ファイル制約を守る */}
      <input
        type="radio"
        name={uid}
        id={`${uid}-bridge`}
        className="v-bridge sr-only"
        defaultChecked
      />
      <input type="radio" name={uid} id={`${uid}-ranked`} className="v-ranked sr-only" />

      <header className="mb-8 flex flex-wrap items-start justify-between gap-4">
        <div>
          <h1 className="text-h1">{title}</h1>
          {subtitle && (
            <p className="mt-2 text-body-sm text-secondary">{subtitle}</p>
          )}
        </div>
        <div className="inline-flex rounded-full border border-outline bg-surface p-1 shadow-card">
          <label
            htmlFor={`${uid}-bridge`}
            className="cursor-pointer rounded-full px-4 py-1.5 text-label text-secondary group-has-[.v-bridge:checked]/waterfall:bg-primary group-has-[.v-bridge:checked]/waterfall:text-on-primary group-has-[.v-bridge:focus-visible]/waterfall:ring-2 group-has-[.v-bridge:focus-visible]/waterfall:ring-tertiary"
          >
            ブリッジ
          </label>
          <label
            htmlFor={`${uid}-ranked`}
            className="cursor-pointer rounded-full px-4 py-1.5 text-label text-secondary group-has-[.v-ranked:checked]/waterfall:bg-primary group-has-[.v-ranked:checked]/waterfall:text-on-primary group-has-[.v-ranked:focus-visible]/waterfall:ring-2 group-has-[.v-ranked:focus-visible]/waterfall:ring-tertiary"
          >
            寄与度順
          </label>
        </div>
      </header>

      {steps.length === 0 ? (
        <p className="text-body-sm text-secondary">ステップが未設定</p>
      ) : (
        <>
          {/* ── ブリッジビュー: 累計配置の浮動バー ──
              data-view はテスト専用フック。v-bridge/v-ranked は input・label・
              このコンテナの3箇所に登場するため class 部分一致では一意に選べない */}
          <div
            data-view="bridge"
            className="hidden group-has-[.v-bridge:checked]/waterfall:block"
          >
            <div className="relative h-72 rounded-lg border border-outline bg-surface">
              <div
                aria-hidden="true"
                className="absolute inset-x-0 border-t border-dashed border-outline"
                style={{ top: `${zero}%` }}
              />
              <div className="flex h-full items-stretch">
                {steps.map((step, i) => {
                  const geom = barGeometry(bars[i], domain);
                  return (
                    <div
                      key={i}
                      data-waterfall-step={i}
                      className="group/step relative flex-1 animate-pop px-1"
                      style={{ animationDelay: stagger(i, 400) }}
                    >
                      <div
                        className={`absolute inset-x-2 rounded-sm ${barColorClass(step)}`}
                        style={{
                          top: `${geom.topPct}%`,
                          height: `${visiblePct(geom.heightPct)}%`,
                        }}
                      />
                    </div>
                  );
                })}
              </div>
            </div>
            <div className="mt-3 flex items-stretch">
              {steps.map((step, i) => (
                <div key={i} data-waterfall-record="true" className="flex-1 px-1 text-center text-label text-secondary">
                  <p>{step.label}</p>
                  <p className="mt-1 font-mono">
                    {step.isTotal ? bars[i].end : signedValue(step.value)}
                  </p>
                </div>
              ))}
            </div>
          </div>

          {/* ── 寄与度順ビュー: total を除いた同じ steps を |value| 降順で並べ替え ── */}
          <div
            data-view="ranked"
            className="hidden flex-col gap-3 group-has-[.v-ranked:checked]/waterfall:flex"
          >
            {ranked.length === 0 ? (
              <p className="text-body-sm text-secondary">差分ステップがありません</p>
            ) : (
              ranked.map((step, i) => {
                const pct = contributionPct(step.value, swing);
                return (
                  <div
                    key={step.originalIndex}
                    className="group/step animate-rise"
                    style={{ animationDelay: stagger(i) }}
                  >
                    <div className="flex items-baseline justify-between gap-2">
                      <span className="text-body-sm">{step.label}</span>
                      <span className="shrink-0 text-label text-secondary">
                        {signedValue(step.value)}({pct.toFixed(1)}%)
                      </span>
                    </div>
                    <div className="mt-1 h-3 w-full rounded-full bg-surface-subtle">
                      <div
                        className={`h-full rounded-full ${barColorClass(step)}`}
                        style={{ width: `${visiblePct(pct)}%` }}
                      />
                    </div>
                  </div>
                );
              })
            )}
            <p className="text-right text-label text-secondary">
              増減の絶対値が大きい順。総変動に占める割合(%)を表示
            </p>
          </div>
        </>
      )}

      {notes.length > 0 && (
        <details data-inline-disclosure="true" className="group mt-6 rounded-lg border border-outline bg-surface-subtle">
          <summary className="flex cursor-pointer list-none items-center px-4 py-3 text-label text-secondary focus-visible:outline focus-visible:outline-2 focus-visible:outline-offset-2 focus-visible:outline-tertiary">
            <span>補足を確認</span>
            <span className="ml-auto font-mono">{notes.length}件</span>
            <span aria-hidden="true" className="ml-2 text-tertiary transition-transform group-open:rotate-45">+</span>
          </summary>
          <div className="grid gap-3 border-t border-outline p-4 sm:grid-cols-2">
            {notes.map((step, index) => (
              <article key={index} data-note-item="true" className="rounded-md bg-surface p-4">
                <h3 className="text-label">{step.label}</h3>
                <p className="mt-1 font-mono text-label text-secondary">
                  {step.isTotal ? `累計 ${step.value}` : `${signedValue(step.value)} ・ 寄与度 ${contributionPct(step.value, swing).toFixed(1)}%`}
                </p>
                <p className="mt-2 text-body-sm">{step.note}</p>
              </article>
            ))}
          </div>
        </details>
      )}
    </section>
  );
}
/designs/waterfall/source/schema.ts
import { z } from "zod";

export const waterfallStepSchema = z
  .object({
    label: z.string().describe("ステップ名(例: 期首実績、新規顧客獲得 など)"),
    value: z
      .number()
      .describe(
        "isTotal: true のときは累計の絶対値(起点・終点・中間集計のアンカー)。false/省略のときは直前の累計に加算される差分(正=増加、負=減少)",
      ),
    isTotal: z
      .boolean()
      .optional()
      .describe(
        "true なら value を累計のリセット地点として扱う(起点・終点・中間小計のアンカー、primary色の構造バー)。省略時は差分ステップ(増加=tertiary/減少=secondary)",
      ),
    note: z
      .string()
      .optional()
      .describe("図の下の補足欄で明示的に展開される詳細(要因・前提・出典など)"),
    highlight: z
      .boolean()
      .optional()
      .describe(
        "最重要の1件のみ true(グラデーション表示。DESIGN.md: 大胆さは1画面1箇所)。寄与度順ビューは isTotal のステップを除外するため、isTotal に highlight を付けると矛盾する",
      ),
  })
  .strict();

export const schema = z
  .object({
    title: z.string().describe("スライドタイトル。結論を書くメッセージラインを推奨"),
    subtitle: z.string().optional().describe("補足・出典など"),
    steps: z.array(waterfallStepSchema),
    instanceId: z
      .string()
      .min(1)
      .optional()
      .describe(
        "同一ページに複数インスタンスを置くときの表示切替トグルの識別子。空文字は不可 — radio の name が空文字だと同一グループとして扱われず表示切替が壊れる",
      ),
  })
  .strict()
  .refine((data) => data.steps.filter((s) => s.highlight === true).length <= 1, {
    message: "highlight は最大1件のみ true にすること(DESIGN.md: 大胆さは1画面1箇所)",
    path: ["steps"],
  })
  .refine((data) => !data.steps.some((s) => s.highlight && s.isTotal), {
    message:
      "highlight は isTotal でないステップに付けること(isTotal は寄与度順ビューで除外されるため強調が消える)",
    path: ["steps"],
  });

export type WaterfallStep = z.infer<typeof waterfallStepSchema>;
export type WaterfallProps = z.infer<typeof schema>;
/designs/waterfall/source/meta.yaml
id: waterfall
name:
  ja: "ウォーターフォールチャート(増減ブリッジ)"
  en: "Waterfall Chart (Change Bridge)"
purpose:
  ja: "起点から終点までの増減要因を累計配置の棒(ブリッジ)で示す。PowerPointのネイティブ滝グラフが自動化する「累計配置」だけでは差別化にならないため、同じデータを寄与度順(|増減|降順)の横棒ランキングに切り替えられる点が核。数値は常時表示し、補足は図の下で展開する"
  en: "The factors between a start and an end as stacked bars. The same data also switches to a ranking by contribution, which is what distinguishes it from a chart tool's built-in bridge"
status: published
# 索引カードの図版。pnpm layout:render が原本から描く。
still: ./still.png
category: breakdown
catalogOrder: 70
jobs:
  - measure-change
  - prioritize-diagnose
useCases:
  - kpi
layoutKinds:
  - waterfall
tags: [waterfall, bridge, breakdown, contribution, data-driven, interactive]
whenToUse:
  - ja: "四半期・年度の利益/売上ブリッジ(期首→期末の増減要因分解)"
    en: "A profit or revenue bridge across a quarter or a year"
  - ja: "コスト増減・原価変動の要因分析"
    en: "Analysing what moved a cost or a unit price"
  - ja: "施策・要因ごとの寄与度をランキングで示したい場合"
    en: "Ranking how much each factor contributed"
  - ja: "単なる推移ではなく「何が」「どれだけ」効いたかを説明したい場合"
    en: "When the point is what moved it and by how much, not the trend"
avoidWhen:
  - ja: "同一母集団が段階ごとに減少する転換を説明したい場合"
    en: "A single population narrowing stage by stage"
  - ja: "複数指標の現在値と目標達成を一覧したい場合"
    en: "Listing several indicators against their targets"
requiredInputs:
  - ja: "起点と終点の値"
    en: "The start and end values"
  - ja: "増減要因ごとの差分値"
    en: "The difference each factor makes"
  - ja: "各要因の補足"
    en: "A note on each factor"
relatedLayouts: [kpi-cards, conversion-funnel, logic-tree]
dataSchema:
  title: "string — スライドタイトル。結論を書くメッセージラインを推奨"
  subtitle: "string(任意)— 補足・出典など"
  steps: "{ label, value, isTotal?, note?, highlight? } の配列。4〜7件が読みやすい(起点・終点を含む)"
  steps[].value: "number — isTotal: true なら累計の絶対値(起点・終点・中間集計のアンカー)。false/省略なら直前の累計に加算される差分(正=増加、負=減少)"
  steps[].isTotal: "boolean(任意)— true なら累計のリセット地点(primary色の構造バー)。省略時は差分(増加=tertiary/減少=secondary)"
  steps[].note: "string(任意)— 図の下の補足欄で明示的に展開される詳細(要因・前提・出典)"
  steps[].highlight: "boolean(任意)— 最重要の1件のみ true。isTotal のステップに付けると寄与度順ビューでは除外され消えるため、差分ステップに付けること(スキーマが拒否する)"
sources: []
/designs/waterfall/source/sample-data.json
{
  "title": "2026年度上期 営業利益ブリッジ — 原材料高騰が新規獲得の伸びを相殺し、営業利益は微減",
  "subtitle": "期首(1Q)実績 → 上期の増減要因 → 期末(2Q)実績(単位: 百万円、経営会議資料サンプル)",
  "steps": [
    { "label": "期首実績(1Q)", "value": 120, "isTotal": true },
    {
      "label": "新規顧客獲得",
      "value": 32,
      "note": "新規契約18社、うち7割が上位プラン。オンボーディング短縮の効果"
    },
    {
      "label": "既存顧客解約",
      "value": -18,
      "note": "解約9社。うち6社は4月の価格改定前の駆け込み解約"
    },
    {
      "label": "原材料費高騰",
      "value": -25,
      "highlight": true,
      "note": "主要部材の仕入価格が四半期で18%上昇。ヘッジ未実施分が直撃した"
    },
    {
      "label": "価格改定効果",
      "value": 14,
      "note": "4月改定の値上げ分。想定より浸透が早く計画超過"
    },
    {
      "label": "システム移行の一時費用",
      "value": -9,
      "note": "基幹システム移行の一時費用。次期以降は発生しない"
    },
    { "label": "期末実績(2Q)", "value": 114, "isTotal": true }
  ]
}