Seen as a design The generated document itself — its toggles and disclosures work here
Seen as a design The generated document itself — its toggles and disclosures work here
Copy and paste, or save a file and hand it over. For a machine with no network, one “Everything” file is enough.
Everything in this panel, including the contents behind each URL, in one Markdown file — Large, so it goes as a file (copy is for 32 KB and under)
Build an HTML document with "KPI Cards (Performance Summary)". This layout runs, so there is no composition to rebuild — what it needs is content.

## What this layout does
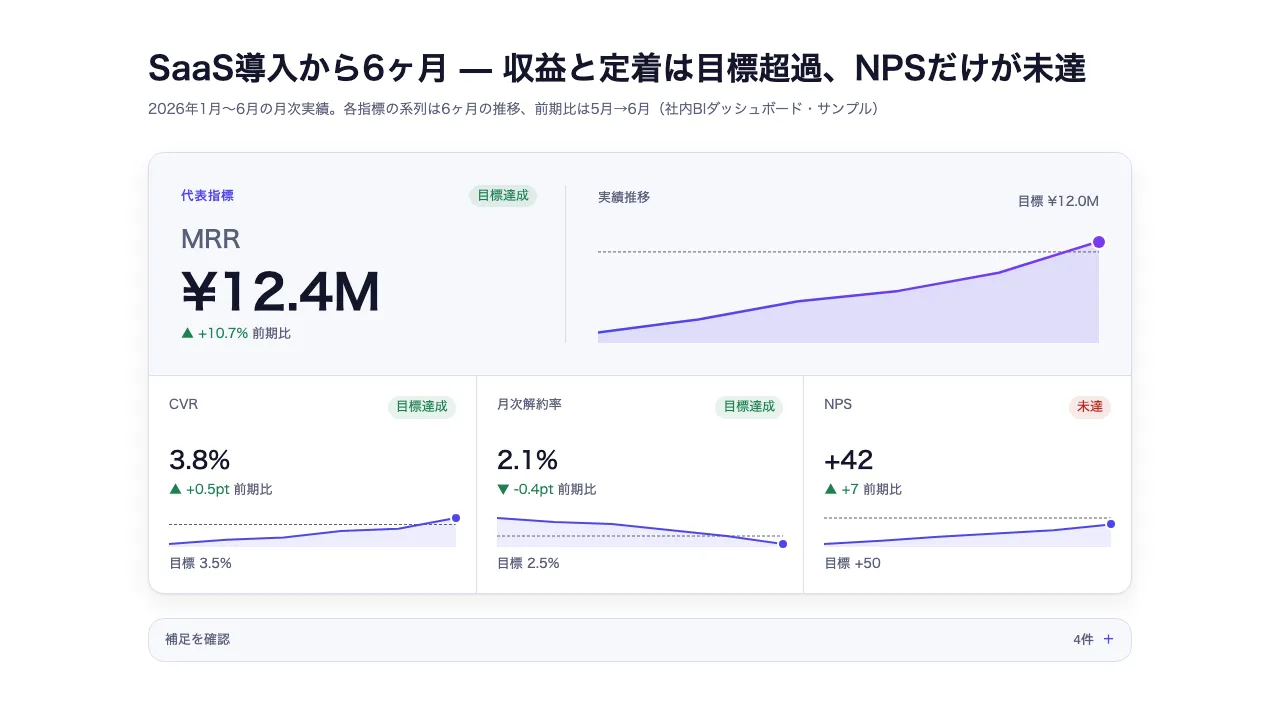
One headline figure with its change, its target and its trend on a single analysis face, the rest arranged into a comparison ledger. Sparklines are drawn from the real series and the target laid over them

## What you have to supply
- What each indicator is
- Its actual values over time
- Its target, and which direction is better

## The shape of the input
- `title` — string — スライドタイトル。結論を書くメッセージラインを推奨
- `subtitle` — string(任意)— 補足・出典など。系列の期間を書くことを推奨
- `metrics` — { label, series, format?, deltaMode?, deltaSuffix?, target?, betterWhen?, note?, highlight? } の配列。4件前後が読みやすい
- `metrics[].series` — number[] — 実データ系列(古い順、最後が現在値、2点以上)。スパークライン・現在値・前期比の唯一の出典。表示用の数値を別に持たせない
- `metrics[].format` — { prefix?, suffix?, decimals?, showSign? } — 現在値の表示形式。例: { prefix: "¥", suffix: "M", decimals: 1 } → ¥12.4M。decimals 省略時は series と target が持つ桁数から推論する(最大4桁)ので、桁を固定したいときだけ書く。showSign は NPS のような増減幅が本体の指標のみ true
- `metrics[].deltaMode` — "relative"(既定・変化率%)または "absolute"(実数差)。%やptの指標は absolute + deltaSuffix "pt" を使う(3.3%→3.8% は「+15%」ではなく「+0.5pt」)
- `metrics[].deltaSuffix` — string(任意)— absolute のときの前期比の単位(例: "pt")。relative では無視される
- `metrics[].target` — number(任意)— 目標値。series と同じ単位の生値。スパークライン上に破線で描かれ、達成/未達バッジを自動判定する
- `metrics[].betterWhen` — "up"(既定)または "down"。down は解約率など下がるほど良い指標。前期比の色と目標達成判定の両方に効く
- `metrics[].note` — string(任意)— カード群の下の補足欄で明示的に展開される詳細(要因・前提・出典)
- `metrics[].highlight` — boolean(任意)— 最重要の1件のみ true。その指標だけが大型sparklineを持つ主分析面になり、残りは比較ledgerへ置かれる。省略時は先頭を暗黙に昇格せず全件同格

schema.ts holds the machine-checkable validation. Ask rather than guess when an input is missing.

## When not to use it
- Explaining cause or hierarchy between indicators
- Breaking a change down from its start to its end

## How to build it
Put the input in a JSON file and run:

```bash
node scripts/render.mjs kpi-cards <input.json> --theme ink -o out.html
```

The output is one self-contained file and fetches nothing at render time.

## The source
- https://design-vault.pages.dev/designs/kpi-cards/source/template.tsx
- https://design-vault.pages.dev/designs/kpi-cards/source/schema.ts
- https://design-vault.pages.dev/designs/kpi-cards/source/sample-data.json
- https://design-vault.pages.dev/designs/kpi-cards/sample.html Template, input schema, sample data and metadata. This document was generated from those four. The generated document
/designs/kpi-cards/source/template.tsx
import { useId } from "react";
import type { KpiCardsProps, Metric, MetricFormat } from "./schema";

/**
 * スパークラインの viewBox。実表示幅はカード幅に合わせて伸縮させるため
 * preserveAspectRatio="none" で描き、線幅の歪みは non-scaling-stroke で打ち消す。
 */
export const SPARK_W = 100;
export const SPARK_H = 32;
/** 線が枠の上下に張り付かないための余白(viewBox 座標) */
const SPARK_PAD = 3;

/** エントランスの時差。間隔は global.css の --stagger-step で統一 */
const stagger = (i: number, baseMs = 0) =>
  `calc(${baseMs}ms + ${i} * var(--stagger-step))`;

/** 現在値 = 系列の最後の要素 */
export const currentValue = (series: number[]) => series[series.length - 1];

/** 前期の値 = 系列の最後から2番目。schema は2点以上を強制するが、
 *  1点しかないデータが来ても NaN を出さないよう先頭にフォールバックする */
export const previousValue = (series: number[]) =>
  series[Math.max(0, series.length - 2)];

/** 前期比の生の差分(現在値 − 前期の値) */
export const computeDelta = (series: number[]) =>
  currentValue(series) - previousValue(series);

const decimalsOf = (n: number) => {
  const s = String(n);
  const dot = s.indexOf(".");
  // 指数表記(1e-7 等)からは桁を読めないので0扱い
  return dot === -1 ? 0 : s.length - dot - 1;
};

/**
 * 値そのものが持つ小数桁。format.decimals 省略時の既定値に使う。
 * 0 に決め打つと 3.8 が "4" と表示され、同じ系列から描くスパークラインが
 * 見出しの数字と食い違う(元データに無い数値を載せることになる)。
 * 浮動小数の誤差(0.30000000000000004 など)は schema と同じ4桁で頭打ちにする。
 */
export const inferDecimals = (values: number[]) =>
  Math.min(4, Math.max(0, ...values.map(decimalsOf)));

/** この指標を何桁で表示するか。目標も同じ桁で出すため値域に含める */
export const resolveDecimals = (metric: Metric) =>
  metric.format?.decimals ??
  inferDecimals(
    metric.target === undefined
      ? metric.series
      : [...metric.series, metric.target],
  );

/**
 * 前期比として画面に出す数値・桁・単位を1箇所で決める。
 * 矢印・符号・色をすべてこの「丸めたあとの値」から導くので、
 * 「▲ +0」のように向きと数字が食い違う表示が構造的に作れない。
 * 変化率が定義できない場合(前期が0以下)は null。
 */
export function displayedDelta(
  metric: Metric,
): { value: number; decimals: number; suffix: string } | null {
  const { series, deltaMode = "relative", deltaSuffix = "" } = metric;
  const raw = computeDelta(series);

  if (deltaMode === "absolute") {
    return { value: raw, decimals: resolveDecimals(metric), suffix: deltaSuffix };
  }

  // 変化率は正の基準値があって初めて意味を持つ。前期が0なら Infinity、
  // 負なら符号が反転して「改善したのにマイナス%」になるため、どちらも表示しない
  const prev = previousValue(series);
  if (prev <= 0) return null;
  return { value: (raw / prev) * 100, decimals: 1, suffix: "%" };
}

/** 丸めたあとの前期比。表示・矢印・色はすべてこの値を見る */
const roundedDelta = (metric: Metric) => {
  const d = displayedDelta(metric);
  return d === null ? null : Number(d.value.toFixed(d.decimals));
};

/**
 * 増減の向き。「良し悪し」は betterWhen で決まる色が担当するので、ここでは向きだけ。
 * 前期比そのものが出せないとき(前期が0以下)は矢印も出さない —
 * "→ —" は「変化なし」と読めてしまい、0 から立ち上がった新規指標を
 * 「動いていない」と誤って伝える。
 */
export function deltaArrow(metric: Metric) {
  const rounded = roundedDelta(metric);
  if (rounded === null) return "";
  if (rounded === 0) return "→";
  return rounded > 0 ? "▲" : "▼";
}

const signed = (n: number, decimals: number) => {
  const body = Math.abs(n).toFixed(decimals);
  // 丸めた結果が0なら符号を付けない("-0.0" は減少とも無変化とも読めてしまう)
  return `${Number(body) === 0 ? "" : n >= 0 ? "+" : "-"}${body}`;
};

/**
 * 系列(と target)を viewBox 座標に写す。
 * - y は上下反転する(SVG は下向きが正、指標は上向きが「大きい」)
 * - 定数列(min === max)は0除算せず中央に水平線を引く
 * - target を値域に含めるので、系列の外側にある目標でも破線が枠内に収まる
 */
export function sparklineGeometry(series: number[], target?: number) {
  const domain = target === undefined ? series : [...series, target];
  const min = Math.min(...domain);
  const max = Math.max(...domain);
  const span = max - min;
  const inner = SPARK_H - SPARK_PAD * 2;
  const toY = (v: number) =>
    span === 0 ? SPARK_H / 2 : SPARK_H - SPARK_PAD - ((v - min) / span) * inner;
  const toX = (i: number) =>
    series.length < 2 ? SPARK_W / 2 : (i / (series.length - 1)) * SPARK_W;
  const round = (n: number) => Number(n.toFixed(2));

  return {
    points: series.map((v, i) => `${round(toX(i))},${round(toY(v))}`).join(" "),
    targetY: target === undefined ? null : round(toY(target)),
    lastX: round(toX(series.length - 1)),
    lastY: round(toY(currentValue(series))),
  };
}

/** 現在値の表示。負号は prefix の外側に出す(¥-5 ではなく -¥5) */
export function formatValue(n: number, format?: MetricFormat) {
  const {
    prefix = "",
    suffix = "",
    decimals = 0,
    showSign = false,
  } = format ?? {};
  const sign = n < 0 ? "-" : showSign ? "+" : "";
  return `${sign}${prefix}${Math.abs(n).toFixed(decimals)}${suffix}`;
}

/**
 * 前期比の表示。
 * relative は変化率(%)、absolute は実数差 + deltaSuffix。
 * 率の指標(3.3% → 3.8%)を relative で出すと「+15%」という別物の数字になるため、
 * その場合は absolute + deltaSuffix "pt" を使う(= "+0.5pt")。
 */
export function formatDelta(metric: Metric): string {
  const d = displayedDelta(metric);
  if (d === null) return "—";
  return `${signed(d.value, d.decimals)}${d.suffix}`;
}

/** 前期比の良し悪し。betterWhen: "down" では減少が改善(解約率など)。
 *  表示上0に丸まる変化は neutral(見えない差を色で主張しない) */
export function deltaTone(metric: Metric): "positive" | "negative" | "neutral" {
  const rounded = roundedDelta(metric);
  if (rounded === null || rounded === 0) return "neutral";
  const improving =
    (metric.betterWhen ?? "up") === "up" ? rounded > 0 : rounded < 0;
  return improving ? "positive" : "negative";
}

/**
 * 目標達成判定。betterWhen: "down" では target 以下が達成。target 無しは null。
 * 画面に出るのは丸めた値なので、判定も同じ桁で行う — 生値で比べると
 * 現在値 11.96 / 目標 12.04 が「12.0 に対して目標 12.0 なのに未達」という
 * 読みようのないカードになる(前期比の矢印と同じ、表示と判定の食い違い)。
 */
export function isAchieved(metric: Metric): boolean | null {
  if (metric.target === undefined) return null;
  const decimals = resolveDecimals(metric);
  const current = Number(currentValue(metric.series).toFixed(decimals));
  const target = Number(metric.target.toFixed(decimals));
  return (metric.betterWhen ?? "up") === "up"
    ? current >= target
    : current <= target;
}

const TONE_CLASS: Record<ReturnType<typeof deltaTone>, string> = {
  positive: "text-success",
  negative: "text-error",
  neutral: "text-secondary",
};

export type MetricRecord = { metric: Metric; index: number };

/**
 * highlight は装飾フラグではなく、画面の結論階層を決める契約として扱う。
 * 指定が無い入力では先頭を暗黙に代表指標へしない。データに無い優先順位を
 * レイアウト側で捏造せず、全件を同格の比較ledgerとして残す。
 */
export function metricHierarchy(metrics: Metric[]): {
  primary: MetricRecord | null;
  supporting: MetricRecord[];
} {
  const primaryIndex = metrics.findIndex((metric) => metric.highlight);
  return {
    primary:
      primaryIndex === -1
        ? null
        : { metric: metrics[primaryIndex], index: primaryIndex },
    supporting: metrics
      .map((metric, index) => ({ metric, index }))
      .filter(({ index }) => index !== primaryIndex),
  };
}

/**
 * 実データ系列から描くスパークライン。target は同じ値域に写した破線で重ねるので、
 * 「線が破線より上/下にあるか」がそのまま達成状況になる(下がるほど良い指標でも
 * 意味が反転しない — プログレスバーの塗り面積では表せない性質)。
 */
function Sparkline({
  metric,
  gradientId,
  size,
}: {
  metric: Metric;
  gradientId: string;
  size: "hero" | "compact";
}) {
  const { points, targetY, lastX, lastY } = sparklineGeometry(
    metric.series,
    metric.target,
  );

  return (
    <div
      data-kpi-chart-size={size}
      className={`relative ${size === "hero" ? "mt-5 h-24 lg:h-28" : "mt-4 h-8"}`}
    >
      <svg
        viewBox={`0 0 ${SPARK_W} ${SPARK_H}`}
        preserveAspectRatio="none"
        className="h-full w-full"
        aria-hidden="true"
      >
        {metric.highlight && (
          <defs>
            <linearGradient id={gradientId} x1="0" y1="0" x2="1" y2="0">
              <stop offset="0%" stopColor="var(--color-tertiary)" />
              <stop offset="100%" stopColor="var(--color-accent-violet)" />
            </linearGradient>
          </defs>
        )}
        <polygon
          data-kpi-area=""
          points={`0,${SPARK_H} ${points} ${SPARK_W},${SPARK_H}`}
          className={metric.highlight ? "fill-tertiary/15" : "fill-tertiary/10"}
        />
        {targetY !== null && (
          <line
            data-kpi-target=""
            x1="0"
            y1={targetY}
            x2={SPARK_W}
            y2={targetY}
            className="stroke-secondary"
            strokeWidth="1"
            strokeDasharray="3 2"
            vectorEffect="non-scaling-stroke"
          />
        )}
        <polyline
          data-kpi-trace=""
          data-kpi-primary-trace={metric.highlight ? "" : undefined}
          points={points}
          fill="none"
          strokeWidth={size === "hero" ? "2.5" : "2"}
          strokeLinecap="round"
          strokeLinejoin="round"
          vectorEffect="non-scaling-stroke"
          stroke={metric.highlight ? `url(#${gradientId})` : undefined}
          className={metric.highlight ? undefined : "stroke-tertiary"}
        />
      </svg>
      {/* 現在値のマーカーは HTML 側で置く。SVG 内の circle は
          preserveAspectRatio="none" で横に引き伸ばされ楕円になるため */}
      <span
        data-kpi-current-marker=""
        className={`absolute -translate-x-1/2 -translate-y-1/2 rounded-full ring-2 ring-surface ${
          size === "hero" ? "size-3" : "size-2"
        } ${
          metric.highlight ? "bg-accent-violet" : "bg-tertiary"
        }`}
        style={{
          left: `${(lastX / SPARK_W) * 100}%`,
          top: `${(lastY / SPARK_H) * 100}%`,
        }}
      />
    </div>
  );
}

function Verdict({ achieved }: { achieved: boolean | null }) {
  if (achieved === null) return null;
  return (
    <span
      className={`shrink-0 whitespace-nowrap rounded-full px-2 py-0.5 text-label ${
        achieved ? "bg-success/10 text-success" : "bg-error/10 text-error"
      }`}
    >
      {achieved ? "目標達成" : "未達"}
    </span>
  );
}

function DeltaLine({ metric }: { metric: Metric }) {
  return (
    <p
      data-kpi-delta=""
      className={`mt-1 text-label ${TONE_CLASS[deltaTone(metric)]}`}
    >
      {deltaArrow(metric)} {formatDelta(metric)}
      <span className="ml-1 text-secondary">前期比</span>
    </p>
  );
}

function TargetLine({
  metric,
  format,
}: {
  metric: Metric;
  format: MetricFormat;
}) {
  if (metric.target === undefined) return null;
  return (
    <p data-kpi-target-label="" className="mt-2 text-label text-secondary">
      目標 {formatValue(metric.target, format)}
    </p>
  );
}

function PrimaryMetric({
  record,
  gradientId,
}: {
  record: MetricRecord;
  gradientId: string;
}) {
  const { metric, index } = record;
  const achieved = isAchieved(metric);
  const format = { ...metric.format, decimals: resolveDecimals(metric) };

  return (
    <article
      data-kpi-primary="true"
      data-priority="true"
      data-kpi-record={index}
      tabIndex={0}
      aria-label={`${metric.label}、代表指標`}
      className="group/metric animate-rise grid gap-7 bg-surface-subtle p-7 focus-visible:outline focus-visible:outline-2 focus-visible:outline-offset-2 focus-visible:outline-tertiary lg:grid-cols-[minmax(0,0.8fr)_minmax(0,1.2fr)] lg:items-end lg:p-8"
      style={{ animationDelay: stagger(index) }}
    >
      <div>
        <div className="flex items-center justify-between gap-3">
          <p className="font-mono text-label tracking-wide text-tertiary">
            代表指標
          </p>
          <Verdict achieved={achieved} />
        </div>
        <h2 className="mt-4 text-h2 text-secondary">{metric.label}</h2>
        <p data-kpi-value="" className="mt-2 text-display">
          {formatValue(currentValue(metric.series), format)}
        </p>
        <DeltaLine metric={metric} />
      </div>

      <div className="min-w-0 border-t border-outline pt-5 lg:border-l lg:border-t-0 lg:pl-8 lg:pt-0">
        <div className="flex items-center justify-between gap-3">
          <p className="text-label text-secondary">実績推移</p>
          <TargetLine metric={metric} format={format} />
        </div>
        <Sparkline metric={metric} gradientId={gradientId} size="hero" />
      </div>
    </article>
  );
}

function SupportingMetric({
  record,
  gradientId,
}: {
  record: MetricRecord;
  gradientId: string;
}) {
  const { metric, index } = record;
  const achieved = isAchieved(metric);
  const format = { ...metric.format, decimals: resolveDecimals(metric) };

  return (
    <article
      data-kpi-supporting="true"
      data-kpi-record={index}
      tabIndex={0}
      aria-label={`${metric.label}を強調`}
      className="group/metric animate-rise min-w-0 bg-surface p-5 focus-visible:outline focus-visible:outline-2 focus-visible:outline-offset-2 focus-visible:outline-tertiary"
      style={{ animationDelay: stagger(index) }}
    >
      <div className="flex min-h-10 items-start justify-between gap-2">
        <h2 className="text-label text-secondary">{metric.label}</h2>
        <Verdict achieved={achieved} />
      </div>
      <p data-kpi-value="" className="mt-2 text-h2">
        {formatValue(currentValue(metric.series), format)}
      </p>
      <DeltaLine metric={metric} />
      <Sparkline metric={metric} gradientId={gradientId} size="compact" />
      <TargetLine metric={metric} format={format} />
    </article>
  );
}

export default function KpiCards({
  title,
  subtitle,
  metrics,
  instanceId,
}: KpiCardsProps) {
  const autoId = useId();
  // useId() は ":r0:" のようにコロンを含む。SVG の url(#...) 参照で使うため
  // ID に使える文字だけに絞る(同一ページの複数インスタンスで衝突させない)。
  // 全部落ちた場合(記号だけの instanceId)は先頭が "-" の不正なIDになるので退避する
  const sanitized = (instanceId ?? autoId).replace(
      // 捨てる操作は単射でないので、schema を通る別々の値が同じ id になる
      // (`sales:a` と `sales/a` がどちらも `salesa`)。同じ文書へ 2 つ置くと
      // id と radio の name が衝突して、片方の操作がもう片方に効く。
      // 逃がし文字(`_`)自身も逃がすので、この変換は単射。
      /[^a-zA-Z0-9-]/g,
      (c) => `_${c.charCodeAt(0).toString(16)}_`,
    );
  const uid = /^[a-zA-Z_]/.test(sanitized) ? sanitized : `id${sanitized}`;
  const notes = metrics.filter((metric) => metric.note);
  const hierarchy = metricHierarchy(metrics);

  return (
    <section className="mx-auto max-w-slide bg-surface p-12 font-sans text-on-surface">
      <style>{`
        [data-kpi-layout]:has([data-kpi-supporting="true"]:is(:hover, :focus)) [data-kpi-primary-trace] {
          opacity: 0.28;
        }
        [data-kpi-supporting="true"]:is(:hover, :focus) [data-kpi-trace] {
          stroke: var(--color-on-surface);
        }
      `}</style>
      <header className="mb-8">
        <h1 className="text-h1">{title}</h1>
        {subtitle && (
          <p className="mt-2 text-body-sm text-secondary">{subtitle}</p>
        )}
      </header>

      {hierarchy.primary ? (
        <div
          data-kpi-layout="hierarchy"
          className="overflow-hidden rounded-lg border border-outline bg-surface shadow-card"
        >
          <PrimaryMetric
            record={hierarchy.primary}
            gradientId={`${uid}-spark-${hierarchy.primary.index}`}
          />
          {hierarchy.supporting.length > 0 && (
            <div
              data-kpi-supporting-ledger="true"
              className="grid gap-px border-t border-outline bg-outline sm:grid-cols-2 lg:grid-cols-3"
            >
              {hierarchy.supporting.map((record) => (
                <SupportingMetric
                  key={record.index}
                  record={record}
                  gradientId={`${uid}-spark-${record.index}`}
                />
              ))}
            </div>
          )}
        </div>
      ) : (
        <div
          data-kpi-layout="comparison"
          className="grid gap-px overflow-hidden rounded-lg border border-outline bg-outline shadow-card sm:grid-cols-2 lg:grid-cols-3"
        >
          {hierarchy.supporting.map((record) => (
            <SupportingMetric
              key={record.index}
              record={record}
              gradientId={`${uid}-spark-${record.index}`}
            />
          ))}
        </div>
      )}

      {notes.length > 0 && (
        <details data-inline-disclosure="true" className="group mt-6 rounded-lg border border-outline bg-surface-subtle">
          <summary className="flex cursor-pointer list-none items-center px-4 py-3 text-label text-secondary focus-visible:outline focus-visible:outline-2 focus-visible:outline-offset-2 focus-visible:outline-tertiary">
            <span>補足を確認</span>
            <span className="ml-auto font-mono">{notes.length}件</span>
            <span aria-hidden="true" className="ml-2 text-tertiary transition-transform group-open:rotate-45">+</span>
          </summary>
          <div className="grid gap-3 border-t border-outline p-4 sm:grid-cols-2">
            {notes.map((metric, index) => (
              <article key={index} data-note-item="true" className="rounded-md bg-surface p-4">
                <h3 className="text-label">{metric.label}</h3>
                <p className="mt-2 text-body-sm">{metric.note}</p>
              </article>
            ))}
          </div>
        </details>
      )}
    </section>
  );
}
/designs/kpi-cards/source/schema.ts
import { z } from "zod";

export const formatSchema = z
  .object({
    prefix: z.string().optional().describe('値の前に付く記号(例: "¥")'),
    suffix: z.string().optional().describe('値の後ろに付く単位(例: "%", "M")'),
    decimals: z
      .number()
      .int()
      .min(0)
      .max(4)
      .optional()
      .describe(
        "小数桁数。省略時は series と target が実際に持つ桁数から推論する(最大4桁)— 0固定にすると 3.8 が「4」と表示され、同じ系列から描くスパークラインと食い違うため。明示すると推論より優先される",
      ),
    showSign: z
      .boolean()
      .optional()
      .describe(
        "現在値そのものに + 符号を付ける。NPS のような増減幅が本体の指標のみ true",
      ),
  })
  .strict();

export const metricSchema = z
  .object({
    label: z.string().describe("指標名(例: MRR)"),
    series: z
      .array(z.number())
      .min(2)
      .describe(
        "実データ系列。古い順に並べ、最後の要素が現在値。スパークライン・現在値・前期比はすべてこの配列から計算されるため、表示用の数値を別に持たせてはいけない(系列と表示値の食い違いを構造的に防ぐ)。2点以上必須(前期比の計算に前期の値が要る)",
      ),
    format: formatSchema.optional(),
    deltaMode: z
      .enum(["relative", "absolute"])
      .optional()
      .describe(
        '前期比の表し方。relative=変化率(%)、absolute=実数差。%やptなど率の指標は absolute + deltaSuffix "pt" を使う(3.3%→3.8% の増分は「+15%」ではなく「+0.5pt」)。省略時は relative',
      ),
    deltaSuffix: z
      .string()
      .optional()
      .describe(
        'deltaMode: "absolute" のときの前期比の単位(例: "pt")。省略時は単位なし。relative のときは無視される(常に %)',
      ),
    target: z
      .number()
      .optional()
      .describe(
        "目標値。series と同じ単位の生値。スパークライン上に破線で引かれ、達成/未達を自動判定してバッジを出す",
      ),
    betterWhen: z
      .enum(["up", "down"])
      .optional()
      .describe(
        '「良い」方向。down は解約率・離脱率など下がるほど良い指標。前期比の色と目標達成判定の両方に効く(矢印の向きは増減そのものを表すので betterWhen では変わらない)。省略時は up',
      ),
    note: z
      .string()
      .optional()
      .describe("カード群の下の補足欄で明示的に展開される詳細(要因・前提・出典など)"),
    highlight: z
      .boolean()
      .optional()
      .describe(
        "最重要の1件のみ true(グラデーション表示。DESIGN.md: 大胆さは1画面1箇所)",
      ),
  })
  .strict();

export const schema = z
  .object({
    title: z.string().describe("スライドタイトル。結論を書くメッセージラインを推奨"),
    subtitle: z
      .string()
      .optional()
      .describe("補足・出典など。系列がどの期間の何の推移かを書くことを推奨"),
    metrics: z.array(metricSchema).min(1),
    instanceId: z
      .string()
      .optional()
      .describe(
        "同一ページに複数インスタンスを置くときの SVG グラデーション ID の識別子",
      ),
  })
  .strict()
  .refine(
    (data) => data.metrics.filter((m) => m.highlight === true).length <= 1,
    {
      message:
        "highlight は最大1件のみ true にすること(DESIGN.md: 大胆さは1画面1箇所)",
      path: ["metrics"],
    },
  );

export type MetricFormat = z.infer<typeof formatSchema>;
export type Metric = z.infer<typeof metricSchema>;
export type KpiCardsProps = z.infer<typeof schema>;
/designs/kpi-cards/source/meta.yaml
id: kpi-cards
name:
  ja: "KPIカード(実績サマリ)"
  en: "KPI Cards (Performance Summary)"
purpose:
  ja: "代表KPIの現在値・前期比・目標達成・推移を一つの主分析面で示し、残りを比較ledgerへ整理する。実データ系列から SVG スパークラインを自動生成し、目標を破線で重ねて達成/未達を自動判定する。解約率のような「下がるほど良い」指標も betterWhen で正しく着色される"
  en: "One headline figure with its change, its target and its trend on a single analysis face, the rest arranged into a comparison ledger. Sparklines are drawn from the real series and the target laid over them"
status: published
# 索引カードの図版。pnpm layout:render が原本から描く。
still: ./still.png
category: metrics
catalogOrder: 30
jobs:
  - measure-change
useCases:
  - kpi
layoutKinds:
  - grid
tags: [kpi, metrics, dashboard, sparkline, data-driven, interactive]
whenToUse:
  - ja: "施策・システム導入後の効果測定サマリ(月次・四半期レビュー)"
    en: "Measuring the effect of an initiative after it lands (monthly or quarterly)"
  - ja: "経営会議やステアリングコミッティ冒頭の実績ダッシュボード"
    en: "The dashboard that opens a steering committee"
  - ja: "目標に対する現在地を指標横断で一覧したい場合"
    en: "Seeing where every indicator stands against its target at once"
  - ja: "数値そのものが主役で、構造や関係性を示す必要がない場合"
    en: "When the numbers themselves are the subject, not the structure behind them"
avoidWhen:
  - ja: "指標同士の因果関係や階層構造を説明したい場合"
    en: "Explaining cause or hierarchy between indicators"
  - ja: "増減要因の内訳を起点から終点まで示したい場合"
    en: "Breaking a change down from its start to its end"
requiredInputs:
  - ja: "指標名"
    en: "What each indicator is"
  - ja: "時系列の実績値"
    en: "Its actual values over time"
  - ja: "目標値と改善方向"
    en: "Its target, and which direction is better"
relatedLayouts: [waterfall, heatmap, conversion-funnel]
dataSchema:
  title: "string — スライドタイトル。結論を書くメッセージラインを推奨"
  subtitle: "string(任意)— 補足・出典など。系列の期間を書くことを推奨"
  metrics: "{ label, series, format?, deltaMode?, deltaSuffix?, target?, betterWhen?, note?, highlight? } の配列。4件前後が読みやすい"
  metrics[].series: "number[] — 実データ系列(古い順、最後が現在値、2点以上)。スパークライン・現在値・前期比の唯一の出典。表示用の数値を別に持たせない"
  metrics[].format: "{ prefix?, suffix?, decimals?, showSign? } — 現在値の表示形式。例: { prefix: \"¥\", suffix: \"M\", decimals: 1 } → ¥12.4M。decimals 省略時は series と target が持つ桁数から推論する(最大4桁)ので、桁を固定したいときだけ書く。showSign は NPS のような増減幅が本体の指標のみ true"
  metrics[].deltaMode: "\"relative\"(既定・変化率%)または \"absolute\"(実数差)。%やptの指標は absolute + deltaSuffix \"pt\" を使う(3.3%→3.8% は「+15%」ではなく「+0.5pt」)"
  metrics[].deltaSuffix: "string(任意)— absolute のときの前期比の単位(例: \"pt\")。relative では無視される"
  metrics[].target: "number(任意)— 目標値。series と同じ単位の生値。スパークライン上に破線で描かれ、達成/未達バッジを自動判定する"
  metrics[].betterWhen: "\"up\"(既定)または \"down\"。down は解約率など下がるほど良い指標。前期比の色と目標達成判定の両方に効く"
  metrics[].note: "string(任意)— カード群の下の補足欄で明示的に展開される詳細(要因・前提・出典)"
  metrics[].highlight: "boolean(任意)— 最重要の1件のみ true。その指標だけが大型sparklineを持つ主分析面になり、残りは比較ledgerへ置かれる。省略時は先頭を暗黙に昇格せず全件同格"
sources: []
/designs/kpi-cards/source/sample-data.json
{
  "title": "SaaS導入から6ヶ月 — 収益と定着は目標超過、NPSだけが未達",
  "subtitle": "2026年1月〜6月の月次実績。各指標の系列は6ヶ月の推移、前期比は5月→6月(社内BIダッシュボード・サンプル)",
  "metrics": [
    {
      "label": "MRR",
      "series": [8.9, 9.4, 10.1, 10.5, 11.2, 12.4],
      "format": { "prefix": "¥", "suffix": "M", "decimals": 1 },
      "target": 12.0,
      "note": "月次経常収益。既存顧客のアップセルが牽引し、6月の新規分 ¥0.8M のうち6割が上位プランへの移行。新規獲得への依存度は下がっている",
      "highlight": true
    },
    {
      "label": "CVR",
      "series": [2.6, 2.8, 2.9, 3.2, 3.3, 3.8],
      "format": { "suffix": "%", "decimals": 1 },
      "deltaMode": "absolute",
      "deltaSuffix": "pt",
      "target": 3.5,
      "note": "申込完了率。入力項目を12→7に削減した4月以降、途中離脱が継続的に改善。6月の伸びは決済手段の追加による寄与が大きい"
    },
    {
      "label": "月次解約率",
      "series": [3.4, 3.2, 3.1, 2.8, 2.5, 2.1],
      "format": { "suffix": "%", "decimals": 1 },
      "deltaMode": "absolute",
      "deltaSuffix": "pt",
      "target": 2.5,
      "betterWhen": "down",
      "note": "オンボーディング面談の必須化で初月解約が半減。目標2.5%は5月に到達し、6月はさらに0.4pt改善した"
    },
    {
      "label": "NPS",
      "series": [18, 22, 27, 31, 35, 42],
      "format": { "decimals": 0, "showSign": true },
      "deltaMode": "absolute",
      "target": 50,
      "note": "推奨者は着実に増えているが批判者が11%残る。自由記述の38%がモバイル対応の遅れを指摘しており、目標50は次期リリース後に再評価する"
    }
  ]
}