作品として見る 生成された文書そのもの — 切り替えも開閉もそのまま動きます
作品として見る 生成された文書そのもの — 切り替えも開閉もそのまま動きます
コピーして貼るか、ファイルに保存して渡す。ネットにつながらない環境には「全部入り」を 1 つ渡せば足りる。
このパネルの中身を、URL の先にあるファイルの中身まで含めて 1 つにまとめた Markdown — 大きいのでファイルで渡す(コピーは 32KB まで)
「モザイク構成図」でHTML資料を作ってください。この型は実行できるので、版面を組み直す必要はありません — 必要なのは中身です。

## この型がすること
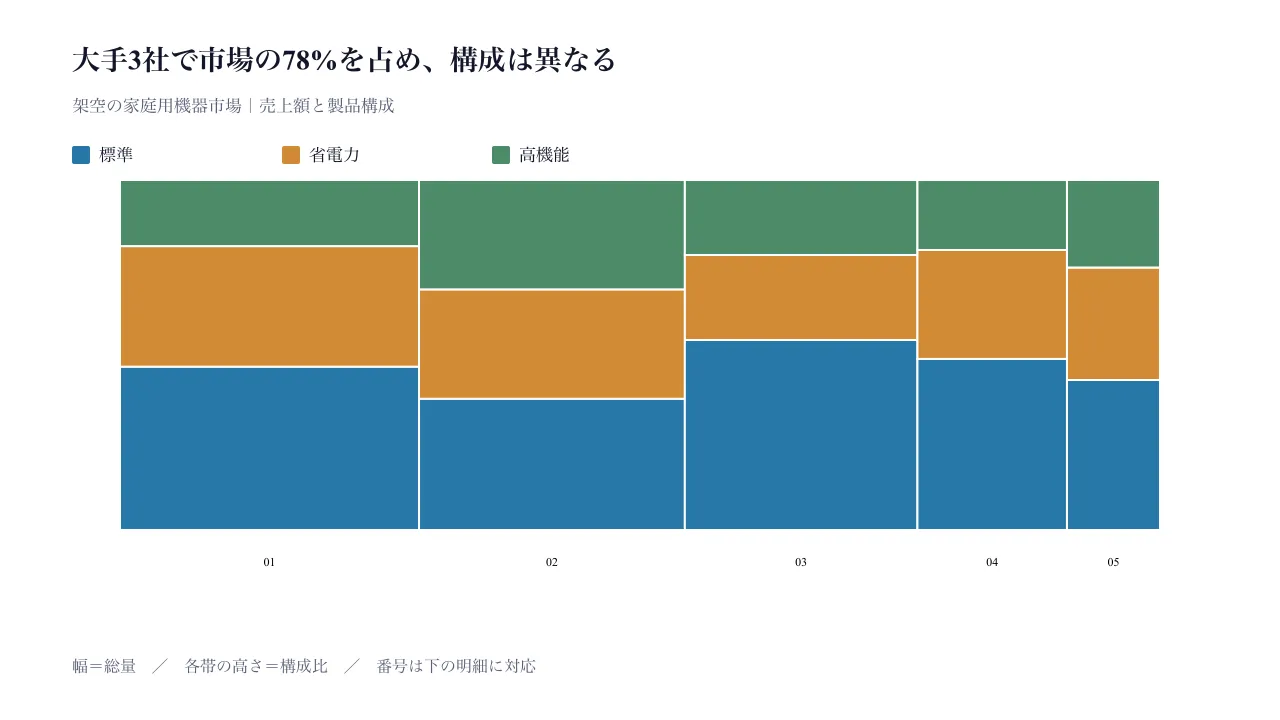
横幅に対象ごとの総量、高さに構成比を割り当て、市場規模と内訳の両方を一枚で比べる。

## 渡す必要があるもの
- 各対象の同じ単位の非負値を入力する。矩形の幅は合計、縦の分割は合計内の割合を表す。
- 対象は2〜6件。各対象が全体の4%以上を占めること。

## 入力の形
- `title` — string — 結論を伝える見出し
- `subtitle` — string? — 対象・単位・時点・母集団
- `unit` — string — 総量の単位
- `series` — array — 構成要素名、2〜4件
- `items` — array (label, values) — 2〜6対象。合計値は正、全体の4%以上

入力の機械可読な検証は schema.ts が持ちます。足りない入力は推測せず質問してください。

## 向かない場合
- 極端に小さい対象が全体の4%未満になる場合。幅が狭く識別しにくいため、別の図を使う。
- 各対象の総量差を隠して構成比だけを比べる場合は、100%積み上げ棒を使う。

## 作り方
入力を JSON にまとめ、次を実行します。

```bash
node scripts/render.mjs marimekko-composition <入力.json> --theme ink -o out.html
```

出力は 1 ファイルで完結し、外部から何も読み込みません。

## 原本
- https://design-vault.pages.dev/designs/marimekko-composition/source/template.tsx
- https://design-vault.pages.dev/designs/marimekko-composition/source/schema.ts
- https://design-vault.pages.dev/designs/marimekko-composition/source/sample-data.json
- https://design-vault.pages.dev/designs/marimekko-composition/sample.html
テンプレート・入力スキーマ・サンプルデータ・メタ情報。この文書はこの 4 つから生成されています。 生成された文書
/designs/marimekko-composition/source/template.tsx
import type { Props } from "./schema";

const joinIds = (...parts: (string | number)[]) =>
  parts.map((part) => String(part).replace(/[_-]/g, (c) => `_${c.charCodeAt(0).toString(16)}_`)).join("-");

const COLORS = ["#2878A8", "#D18B35", "#4D8B68", "#8A6FB0"];
const fmt = (n: number) => Number.isInteger(n) ? n.toLocaleString("ja-JP") : n.toLocaleString("ja-JP", { maximumFractionDigits: 1 });

export default function Template(d: Props) {
  const totals = d.items.map(row => row.values.reduce((a, b) => a + b, 0));
  const grandTotal = totals.reduce((a, b) => a + b, 0);
  const titleLines = titleLinesFor(d.title);
  const subtitleLines = d.subtitle ? wrapLines(d.subtitle, 64) : [];
  const titleY = 70;
  const subtitleY = titleY + titleLines.length * 34 + 8;
  const legendY = subtitleY + subtitleLines.length * 22 + 12;
  const plotY = legendY + 34;
  const plot = { x: 120, y: plotY, w: 1040, h: Math.max(150, 530 - plotY) };
  let x = plot.x;
  const rects: { x: number; y: number; w: number; h: number; item: number; series: number }[] = [];
  const boundaries = [plot.x];
  d.items.forEach((row, item) => {
    const width = plot.w * totals[item] / grandTotal;
    let y = plot.y + plot.h;
    row.values.forEach((value, series) => {
      const height = plot.h * value / totals[item];
      y -= height;
      rects.push({ x, y, w: width, h: height, item, series });
    });
    x += width;
    boundaries.push(x);
  });
  return <section className="asset asset-marimekko">
    <style>{`.asset{font-family:var(--font-sans);color:var(--color-on-surface);background:var(--color-surface);max-width:var(--container-slide);margin:auto;padding:2rem;line-height:1.5;font-size:var(--text-body-sm)}.asset *{box-sizing:border-box}.asset h1{font-size:var(--text-h1);line-height:1.3;margin:0 0 .5rem}.muted{color:var(--color-secondary)}.plot{display:block;width:100%;height:auto}.plot .svg-title,.plot .svg-subtitle{display:none}.legend{display:flex;flex-wrap:wrap;gap:.5rem 1.5rem;margin:1rem 0}.legend span{display:flex;gap:.5rem;align-items:center}.swatch{width:1rem;height:1rem;border-radius:2px}.key{font:600 16px var(--font-mono);fill:var(--color-on-surface)}.ledger{width:100%;border-collapse:collapse;margin-top:1.5rem}.ledger th,.ledger td{text-align:left;padding:.65rem .5rem;border-bottom:1px solid var(--color-outline);font-variant-numeric:tabular-nums}.ledger th{color:var(--color-secondary)}.ledger td:not(:first-child),.ledger th:not(:first-child){text-align:right}.explain{margin-top:1.5rem;padding:1rem;background:var(--color-surface-subtle);border-radius:var(--radius-sm)}@media(max-width:640px){.asset{padding:1rem}.asset h1{font-size:var(--text-h2)}.plot{display:none}.ledger,.ledger tbody,.ledger tr,.ledger td{display:block}.ledger thead{display:none}.ledger tr{padding:.75rem 0;border-bottom:1px solid var(--color-outline)}.ledger td{border:0;padding:.2rem 0}.ledger td:not(:first-child){display:inline-block;text-align:left;margin-right:.75rem}.ledger td:not(:first-child)::before{content:attr(data-label) ": ";color:var(--color-secondary)}}`}</style>
    <header><p className="muted">MARIMEKKO · 市場規模 × 構成比</p><h1>{d.title}</h1>{d.subtitle && <p className="muted">{d.subtitle}</p>}</header>
    <div className="legend">{d.series.map((name, i) => <span key={name}><i className="swatch" style={{ background: COLORS[i] }} />{name}</span>)}</div>
    <svg className="plot" data-layout-still="true" xmlns="http://www.w3.org/2000/svg" width="1280" height="720" viewBox="0 0 1280 720" role="img" aria-label="幅は対象の総量、高さの分割は構成比を示すモザイク図">
      <rect width="1280" height="720" fill="var(--color-surface)" />
      {titleLines.map((line, i) => <text key={i} className="svg-title" x="72" y={titleY + i * 34} fontSize="28" fontWeight="700" fill="var(--color-on-surface)">{line}</text>)}
      {subtitleLines.map((line, i) => <text key={i} className="svg-subtitle" x="72" y={subtitleY + i * 22} fontSize="17" fill="var(--color-secondary)">{line}</text>)}
      {d.series.map((name, i) => <g key={name} transform={`translate(${72 + i * 210} ${legendY})`}><rect width="18" height="18" rx="2" fill={COLORS[i]} /><text x="27" y="15" fontSize="17" fill="var(--color-on-surface)">{name}</text></g>)}
      {rects.map(cell => <rect key={joinIds(cell.item, cell.series)} x={cell.x} y={cell.y} width={cell.w} height={cell.h} fill={COLORS[cell.series]} stroke="var(--color-surface)" strokeWidth="2" />)}
      {d.items.map((_, i) => <text key={i} className="key" x={(boundaries[i] + boundaries[i + 1]) / 2} y={plot.y + plot.h + 36} textAnchor="middle">{String(i + 1).padStart(2, "0")}</text>)}
      <text x="72" y="672" fontSize="16" fill="var(--color-secondary)">幅=総量 / 各帯の高さ=構成比 / 番号は下の明細に対応</text>
    </svg>
    <table className="ledger"><thead><tr><th>番号</th><th>対象</th><th>総量({d.unit})</th>{d.series.map(name => <th key={name}>{name}</th>)}</tr></thead><tbody>{d.items.map((row, i) => <tr key={row.label}><td>{String(i + 1).padStart(2, "0")}</td><td>{row.label}</td><td>{fmt(totals[i])}</td>{row.values.map((value, j) => <td key={d.series[j]} data-label={d.series[j]}>{fmt(value)} · {fmt(value / totals[i] * 100)}%</td>)}</tr>)}</tbody></table>
    <p className="explain">幅は対象ごとの総量に比例し、各対象の内部は構成比100%に正規化しています。幅が小さい対象の細かな値は表で確認してください。</p>
    <footer className="muted">合計の差を保ったまま、構成の違いを比較するための図です。架空のサンプルデータを使用しています。</footer>
  </section>;
}

function titleLinesFor(title: string) {
  return wrapLines(title, 34);
}

function wrapLines(text: string, width: number) {
  return Array.from({ length: Math.ceil([...text].length / width) }, (_, i) => [...text].slice(i * width, (i + 1) * width).join(""));
}
/designs/marimekko-composition/source/schema.ts
import { z } from "zod";

const text = z.string().trim().min(1).max(160);
const short = z.string().trim().min(1).max(12);
const value = z.number().finite().nonnegative();
const unique = (values: string[]) => new Set(values).size === values.length;

export const schema = z.object({
  title: text.describe("市場または構成の結論"),
  subtitle: text.optional().describe("対象・単位・時点・母集団"),
  unit: z.string().trim().min(1).max(6).describe("総量の単位"),
  series: z.array(z.string().trim().min(1).max(12)).min(2).max(4).describe("各帯の構成要素"),
  items: z.array(z.object({
    label: short.describe("市場・集団名"),
    values: z.array(value).min(2).max(4).describe("各構成要素の実数"),
  }).strict()).min(2).max(6).describe("各矩形の幅は総量、縦分割は構成比を表す"),
}).strict().refine(d => {
  const totals = d.items.map(row => row.values.reduce((a, b) => a + b, 0));
  const grandTotal = totals.reduce((a, b) => a + b, 0);
  return unique(d.series) && d.items.every(row => row.values.length === d.series.length) &&
    totals.every(total => total > 0 && total / grandTotal >= 0.04);
}, "構成要素名と各対象の値の個数を揃え、各総量を正にし、全体の4%以上を保つ");

export type Props = z.infer<typeof schema>;
/designs/marimekko-composition/source/meta.yaml
id: marimekko-composition
name:
  ja: モザイク構成図
  en: Marimekko Composition Chart
purpose:
  ja: 横幅に対象ごとの総量、高さに構成比を割り当て、市場規模と内訳の両方を一枚で比べる。
  en: Compare category totals by width and within-category composition by height.
status: published
still: ./still.png
category: analysis
catalogOrder: 730
jobs:
  - measure-change
  - compare-choose
useCases:
  - comparison
  - kpi
layoutKinds:
  - area
tags:
  - marimekko
  - mosaic
  - market-share
  - offline
  - responsive
whenToUse:
  - ja: 対象ごとに総量が異なり、その内訳も同時に比較したい。
    en: Use when category totals differ and their internal composition also matters.
  - ja: 各対象の総量と、構成要素の割合を同じ図で見比べたい。
    en: Use to compare category sizes and component shares in one view.
avoidWhen:
  - ja: 極端に小さい対象が全体の4%未満になる場合。幅が狭く識別しにくいため、別の図を使う。
    en: Avoid when a category is below 4% of the total; its width becomes too narrow to identify.
  - ja: 各対象の総量差を隠して構成比だけを比べる場合は、100%積み上げ棒を使う。
    en: Use a 100% stacked bar when total-size differences should be removed.
requiredInputs:
  - ja: 各対象の同じ単位の非負値を入力する。矩形の幅は合計、縦の分割は合計内の割合を表す。
    en: Provide non-negative values in one unit; width shows the total and vertical subdivisions show within-category shares.
  - ja: 対象は2〜6件。各対象が全体の4%以上を占めること。
    en: Provide 2 to 6 categories, each accounting for at least 4% of the grand total.
relatedLayouts:
  - stacked-composition
  - treemap-budget-allocation
dataSchema:
  title: string — 結論を伝える見出し
  subtitle: string? — 対象・単位・時点・母集団
  unit: string — 総量の単位
  series: array — 構成要素名、2〜4件
  items: array (label, values) — 2〜6対象。合計値は正、全体の4%以上
sources: []
/designs/marimekko-composition/source/sample-data.json
{
  "title": "大手3社で市場の78%を占め、構成は異なる",
  "subtitle": "架空の家庭用機器市場|売上額と製品構成",
  "unit": "億円",
  "series": ["標準", "省電力", "高機能"],
  "items": [
    { "label": "北辰", "values": [420, 310, 170] },
    { "label": "青葉", "values": [300, 250, 250] },
    { "label": "東都", "values": [380, 170, 150] },
    { "label": "明光", "values": [220, 140, 90] },
    { "label": "西海", "values": [120, 90, 70] }
  ]
}