As measured
1920 × 1080 Seen as a design The artboard itself, drawn live — sharp at any zoom Structure, margins and columns overlaid
1920 × 1080 Seen as a design The artboard itself, drawn live — sharp at any zoom Structure, margins and columns overlaid
Copy and paste, or save a file and hand it over. For a machine with no network, one “Everything” file is enough.
Everything in this panel, including the contents behind each URL, in one Markdown file — Large, so it goes as a file (copy is for 32 KB and under)
Produce one slide to the following specification.

- Canvas 1920 × 1080
- Margin top 100 right 140 bottom 100 left 140

## Type (px against a 1920px canvas)
title  46px / 700 / tracking 0.01em
subtitle  22px / 500
axisTitle  22px / 700
tick  20px / 500
percentile  20px / 700
label  20px / 500
value  28px / 700
legend  20px / 500
takeaway  28px / 500
note  20px / 400

## Colour
Ground #FFFFFF / Surface #F4F6F9 / Ink #131820 / Muted #667183 / Accent #1F5FA8 / Rule #DBE1E9 / #668CB9 / #A85A2E

## Constraints — dropping these breaks it
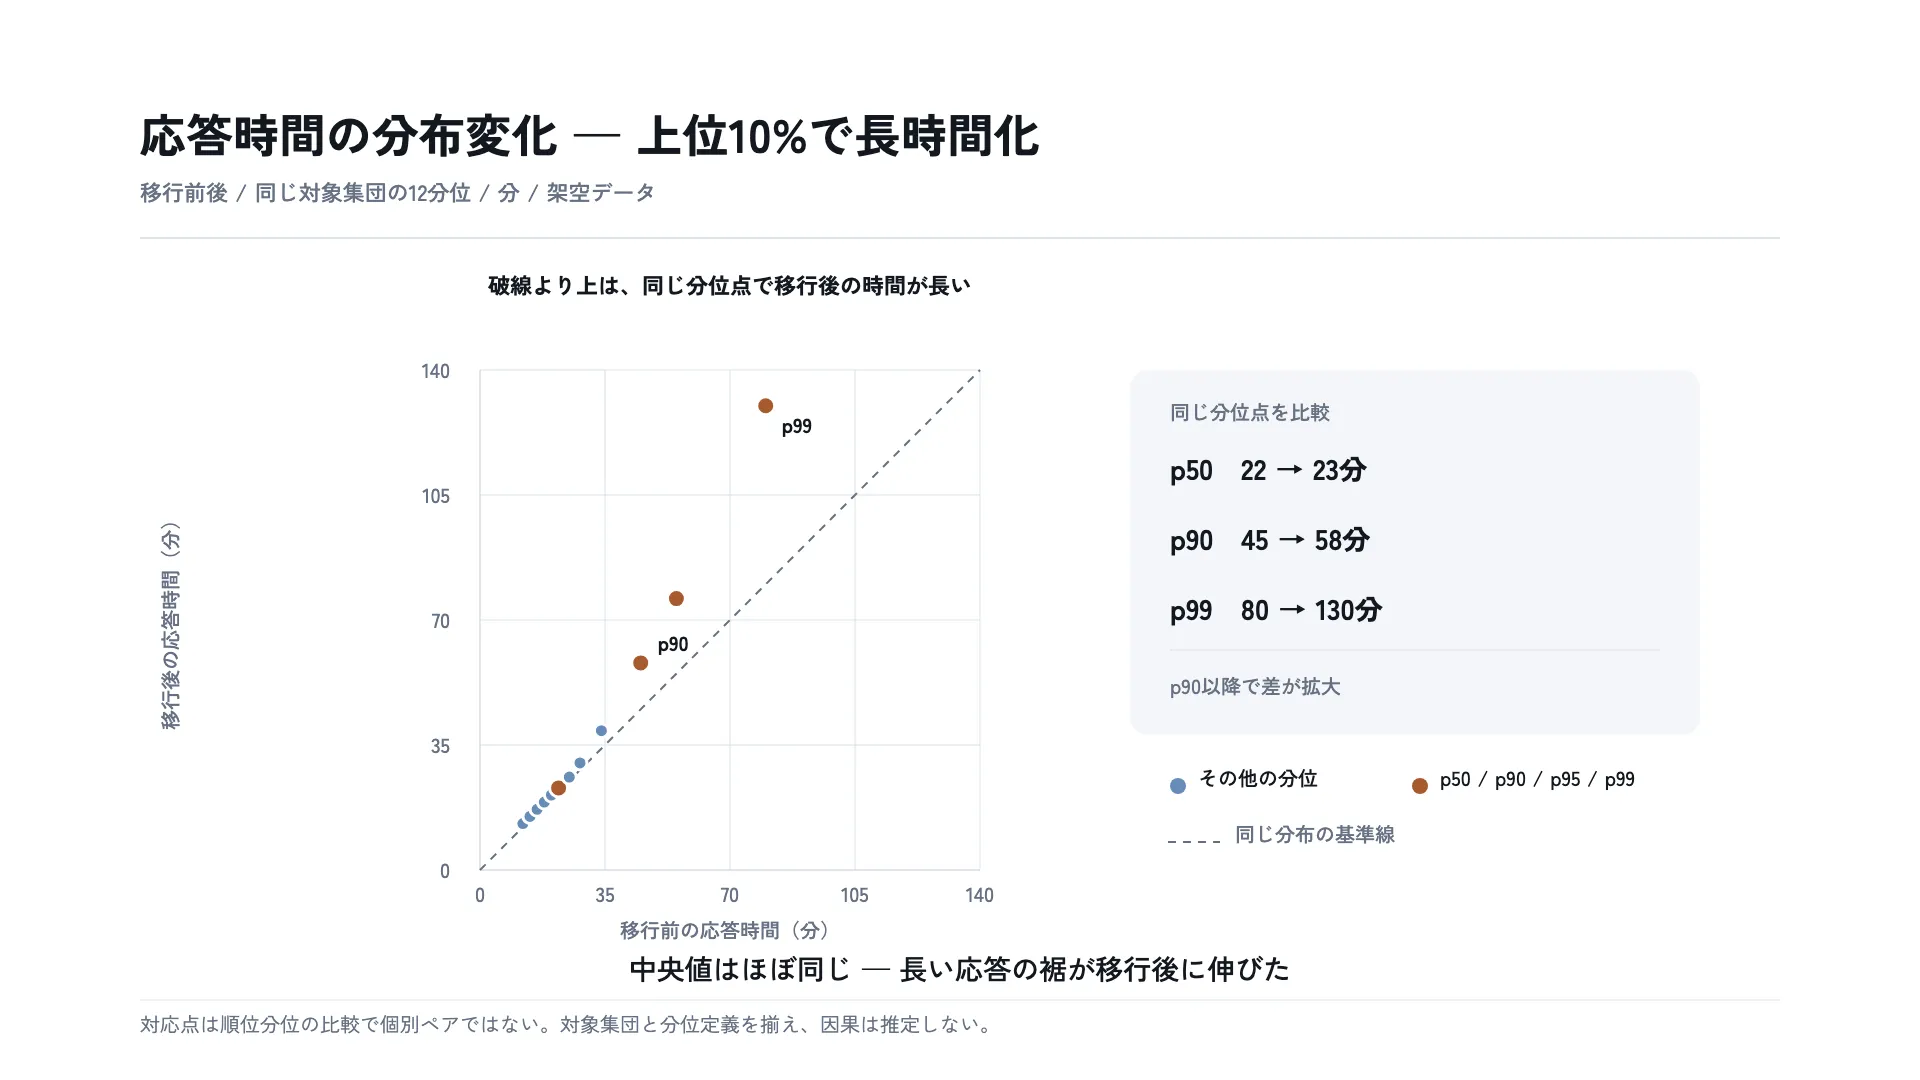
- Compare the same 12 quantiles before and after as distributions, not as paired individual observations.
- Both axes use the same 0–140 minute scale; the dashed line is y=x where the distributions match.
- Points above the line are slower after migration at the same quantile; the gap widens from p90 to p99.
- Fictional data. Align population, measurement definitions, and quantile method; do not infer causality.

Replace the content with [your content]. Keep the measurements and colours as given.
For an exact reproduction, use the verbatim HTML at https://design-vault.pages.dev/designs/qq-plot-response-time-distribution-shift/pattern.html.
/ai/designs/qq-plot-response-time-distribution-shift.json
format: slide-16x9
density: medium
layout:
  kind: axis
  canvas:
    w: 1920
    h: 1080
  margin:
    top: 100
    right: 140
    bottom: 100
    left: 140
type:
  title:
    size: 46
    weight: 700
    tracking: 0.01em
  subtitle:
    size: 22
    weight: 500
  axisTitle:
    size: 22
    weight: 700
  tick:
    size: 20
    weight: 500
  percentile:
    size: 20
    weight: 700
  label:
    size: 20
    weight: 500
  value:
    size: 28
    weight: 700
  legend:
    size: 20
    weight: 500
  takeaway:
    size: 28
    weight: 500
  note:
    size: 20
    weight: 400
colors:
  ground: "#FFFFFF"
  surface: "#F4F6F9"
  ink: "#131820"
  muted: "#667183"
  accent: "#1F5FA8"
  rule: "#DBE1E9"
  series:
    - "#668CB9"
    - "#A85A2E"
rules:
  - Compare the same 12 quantiles before and after as distributions, not as paired individual observations.
  - Both axes use the same 0–140 minute scale; the dashed line is y=x where the distributions match.
  - Points above the line are slower after migration at the same quantile; the gap widens from p90 to p99.
  - Fictional data. Align population, measurement definitions, and quantile method; do not infer causality.
{
"format": "slide-16x9",
"density": "medium",
"layout": {
"kind": "axis",
"canvas": {
"w": 1920,
"h": 1080
},
"margin": {
"top": 100,
"right": 140,
"bottom": 100,
"left": 140
}
},
"type": {
"title": {
"size": 46,
"weight": 700,
"tracking": "0.01em"
},
"subtitle": {
"size": 22,
"weight": 500
},
"axisTitle": {
"size": 22,
"weight": 700
},
"tick": {
"size": 20,
"weight": 500
},
"percentile": {
"size": 20,
"weight": 700
},
"label": {
"size": 20,
"weight": 500
},
"value": {
"size": 28,
"weight": 700
},
"legend": {
"size": 20,
"weight": 500
},
"takeaway": {
"size": 28,
"weight": 500
},
"note": {
"size": 20,
"weight": 400
}
},
"colors": {
"ground": "#FFFFFF",
"surface": "#F4F6F9",
"ink": "#131820",
"muted": "#667183",
"accent": "#1F5FA8",
"rule": "#DBE1E9",
"series": [
"#668CB9",
"#A85A2E"
]
},
"rules": [
"Compare the same 12 quantiles before and after as distributions, not as paired individual observations.",
"Both axes use the same 0–140 minute scale; the dashed line is y=x where the distributions match.",
"Points above the line are slower after migration at the same quantile; the gap widens from p90 to p99.",
"Fictional data. Align population, measurement definitions, and quantile method; do not infer causality."
]
} /designs/qq-plot-response-time-distribution-shift/pattern.html — The artboard itself, font subset included — open it and this picture draws.
<!doctype html><meta charset="utf-8"><title>応答時間の分布変化 — 上位10%で長時間化</title><meta name="dv-font" content="Zen Kaku Gothic New:400;500;700"><link rel="stylesheet" href="./font.css"><style>:root{--ground:#FFFFFF;--surface:#F4F6F9;--ink:#131820;--muted:#667183;--accent:#1F5FA8;--rule:#DBE1E9;--series-1:#668CB9;--series-2:#A85A2E;}*{box-sizing:border-box;margin:0}html,body{width:1920px;height:1080px}body{font-family:"Zen Kaku Gothic New","Hiragino Sans",sans-serif}.artboard{width:1920px;height:1080px;padding:100px 140px;background:var(--ground);color:var(--ink)}.content{width:100%;height:100%;position:relative}.figure{position:absolute;left:-140px;top:-100px;width:1920px;height:1080px}</style><div class="artboard" data-artboard><div class="content" data-content><svg class="figure" width="1920" height="1080" viewBox="0 0 1920 1080" xmlns="http://www.w3.org/2000/svg" role="img" aria-label="架空の移行前後の応答時間分布を12の分位点で比較するQ-Q plot。90パーセンタイルは45分から58分、99パーセンタイルは80分から130分へ移動。"><style>.figure{font-family:"Zen Kaku Gothic New","Hiragino Sans",sans-serif}.ground{fill:var(--ground)}.ink{fill:var(--ink)}.muted{fill:var(--muted)}.rule{stroke:var(--rule)}.title{font-size:46px;font-weight:700;letter-spacing:.01em}.subtitle{font-size:22px;font-weight:500}.axis-title{font-size:22px;font-weight:700}.tick{font-size:20px;font-weight:500}.pct-label{font-size:20px;font-weight:700}.label{font-size:20px;font-weight:500}.value{font-size:28px;font-weight:700}.takeaway{font-size:28px;font-weight:500}.note{font-size:20px;font-weight:400}.reference{fill:none;stroke:var(--muted);stroke-width:2;stroke-dasharray:8 7}.point{fill:var(--series-1);stroke:var(--ground);stroke-width:3}.point-key{fill:var(--series-2);stroke:var(--ground);stroke-width:3}</style><rect class="ground" width="1920" height="1080"/><text class="ink title" data-type="title" x="140" y="153">応答時間の分布変化 — 上位10%で長時間化</text><text class="muted subtitle" data-type="subtitle" x="140" y="201">移行前後 / 同じ対象集団の12分位 / 分 / 架空データ</text><line class="rule" x1="140" y1="238" x2="1780" y2="238" stroke-width="2"/><text class="ink axis-title" data-type="axisTitle" x="730" y="294" text-anchor="middle">破線より上は、同じ分位点で移行後の時間が長い</text><line class="rule" x1="480" y1="370" x2="480" y2="870" stroke-width="1"/><line class="rule" x1="480" y1="870" x2="980" y2="870" stroke-width="1"/><line class="rule" x1="605" y1="370" x2="605" y2="870" stroke-width="1"/><line class="rule" x1="480" y1="745" x2="980" y2="745" stroke-width="1"/><line class="rule" x1="730" y1="370" x2="730" y2="870" stroke-width="1"/><line class="rule" x1="480" y1="620" x2="980" y2="620" stroke-width="1"/><line class="rule" x1="855" y1="370" x2="855" y2="870" stroke-width="1"/><line class="rule" x1="480" y1="495" x2="980" y2="495" stroke-width="1"/><line class="rule" x1="980" y1="370" x2="980" y2="870" stroke-width="1"/><line class="rule" x1="480" y1="370" x2="980" y2="370" stroke-width="1"/><line class="rule" x1="480" y1="870" x2="980" y2="870" stroke-width="1.5"/><line class="rule" x1="480" y1="370" x2="480" y2="870" stroke-width="1.5"/><path class="reference" d="M 480 870 L 980 370"/><circle class="point" cx="522.9" cy="823.6" r="7"/><circle class="point" cx="530.0" cy="816.4" r="7"/><circle class="point" cx="537.1" cy="809.3" r="7"/><circle class="point" cx="544.3" cy="802.1" r="7"/><circle class="point" cx="551.4" cy="795.0" r="7"/><circle class="point-key" cx="558.6" cy="787.9" r="9"/><circle class="point" cx="569.3" cy="777.1" r="7"/><circle class="point" cx="580.0" cy="762.9" r="7"/><circle class="point" cx="601.4" cy="730.7" r="7"/><circle class="point-key" cx="640.7" cy="662.9" r="9"/><text class="ink pct-label" data-type="percentile" x="657.7142857142858" y="650.8571428571429">p90</text><circle class="point-key" cx="676.4" cy="598.6" r="9"/><circle class="point-key" cx="765.7" cy="405.7" r="9"/><text class="ink pct-label" x="781.7142857142858" y="432.7142857142857">p99</text><text class="muted tick" data-type="tick" x="480" y="902" text-anchor="middle">0</text><text class="muted tick" x="450" y="870" text-anchor="end" dominant-baseline="central">0</text><text class="muted tick" data-type="tick" x="605" y="902" text-anchor="middle">35</text><text class="muted tick" x="450" y="745" text-anchor="end" dominant-baseline="central">35</text><text class="muted tick" data-type="tick" x="730" y="902" text-anchor="middle">70</text><text class="muted tick" x="450" y="620" text-anchor="end" dominant-baseline="central">70</text><text class="muted tick" data-type="tick" x="855" y="902" text-anchor="middle">105</text><text class="muted tick" x="450" y="495" text-anchor="end" dominant-baseline="central">105</text><text class="muted tick" data-type="tick" x="980" y="902" text-anchor="middle">140</text><text class="muted tick" x="450" y="370" text-anchor="end" dominant-baseline="central">140</text><text class="muted tick" x="730" y="938" text-anchor="middle">移行前の応答時間(分)</text><text class="muted tick" x="178" y="620" text-anchor="middle" transform="rotate(-90 178 620)">移行後の応答時間(分)</text><rect x="1130" y="370" width="570" height="365" rx="18" fill="var(--surface)"/><text class="muted label" x="1170" y="420">同じ分位点を比較</text><text class="ink value" data-type="value" x="1170" y="480">p50 22 → 23分</text><text class="ink value" x="1170" y="550">p90 45 → 58分</text><text class="ink value" x="1170" y="620">p99 80 → 130分</text><line class="rule" x1="1170" y1="650" x2="1660" y2="650"/><text class="muted label" x="1170" y="694">p90以降で差が拡大</text><circle cx="1178" cy="786" r="8" fill="var(--series-1)"/><text class="ink label" data-type="legend" x="1198" y="786">その他の分位</text><circle cx="1420" cy="786" r="8" fill="var(--series-2)"/><text class="ink label" x="1440" y="786">p50 / p90 / p95 / p99</text><line class="reference" x1="1168" y1="842" x2="1220" y2="842"/><text class="muted label" x="1235" y="842">同じ分布の基準線</text><text class="ink takeaway" data-type="takeaway" x="960" y="980" text-anchor="middle">中央値はほぼ同じ — 長い応答の裾が移行後に伸びた</text><line class="rule" x1="140" y1="1000" x2="1780" y2="1000" stroke-width="1"/><text class="muted note" data-type="note" x="140" y="1032">対応点は順位分位の比較で個別ペアではない。対象集団と分位定義を揃え、因果は推定しない。</text></svg></div></div> /designs/qq-plot-response-time-distribution-shift/font.css — Not in Everything
/* dv-subset v2 — generated by scripts/subset-font.mjs. Do not edit.
 * font    Zen Kaku Gothic New 400;500;700
 * chars   91 (1086129e515f36f3)
 *
 * pattern.html の文字だけを含む部分集合。描画時に外部へ取りに行かないよう同梱する。
 * 版の文字を変えたら取り直すこと — 忘れると足りない字が豆腐になる。
 * その取り忘れは pattern-entries.test.ts が上の指紋で検出する。
 */

@font-face {
  font-family: 'Zen Kaku Gothic New';
  font-style: normal;
  font-weight: 400;
  font-display: block;
  src: url(./font-0.woff2) format('woff2');
  unicode-range: U+25, U+2f-35, U+37-39, U+70, U+2014, U+2192, U+3001-3002, U+3044, U+3048, U+304b-304c, U+3057-3058, U+305d-3060, U+3066-306b, U+306e-3074, U+307b-307d, U+3088, U+308a, U+3092, U+3099-309a, U+30a2, U+30bf-30c0, U+30c6-30c7, U+30d8-30da, U+30fc, U+4e0a, U+4e2d, U+4ed6, U+4ee5, U+4f38, U+4f4d, U+500b, U+5024, U+5206, U+5225, U+524d, U+5316, U+540c, U+56e0, U+56e3, U+57fa, U+5909, U+5927, U+592e, U+5b9a, U+5bfe, U+5dee, U+5e03, U+5f8c, U+5fdc, U+62e1, U+63a8, U+63c3, U+6642, U+679c, U+67b6, U+6bd4, U+6e96, U+70b9, U+7834, U+79fb, U+7a7a, U+7b54, U+7dda, U+7fa9, U+884c, U+88fe, U+8c61, U+8f03, U+9577, U+9593, U+964d, U+96c6, U+9806, U+ff08-ff09;
}
@font-face {
  font-family: 'Zen Kaku Gothic New';
  font-style: normal;
  font-weight: 500;
  font-display: block;
  src: url(./font-1.woff2) format('woff2');
  unicode-range: U+25, U+2f-35, U+37-39, U+70, U+2014, U+2192, U+3001-3002, U+3044, U+3048, U+304b-304c, U+3057-3058, U+305d-3060, U+3066-306b, U+306e-3074, U+307b-307d, U+3088, U+308a, U+3092, U+3099-309a, U+30a2, U+30bf-30c0, U+30c6-30c7, U+30d8-30da, U+30fc, U+4e0a, U+4e2d, U+4ed6, U+4ee5, U+4f38, U+4f4d, U+500b, U+5024, U+5206, U+5225, U+524d, U+5316, U+540c, U+56e0, U+56e3, U+57fa, U+5909, U+5927, U+592e, U+5b9a, U+5bfe, U+5dee, U+5e03, U+5f8c, U+5fdc, U+62e1, U+63a8, U+63c3, U+6642, U+679c, U+67b6, U+6bd4, U+6e96, U+70b9, U+7834, U+79fb, U+7a7a, U+7b54, U+7dda, U+7fa9, U+884c, U+88fe, U+8c61, U+8f03, U+9577, U+9593, U+964d, U+96c6, U+9806, U+ff08-ff09;
}
@font-face {
  font-family: 'Zen Kaku Gothic New';
  font-style: normal;
  font-weight: 700;
  font-display: block;
  src: url(./font-2.woff2) format('woff2');
  unicode-range: U+25, U+2f-35, U+37-39, U+70, U+2014, U+2192, U+3001-3002, U+3044, U+3048, U+304b-304c, U+3057-3058, U+305d-3060, U+3066-306b, U+306e-3074, U+307b-307d, U+3088, U+308a, U+3092, U+3099-309a, U+30a2, U+30bf-30c0, U+30c6-30c7, U+30d8-30da, U+30fc, U+4e0a, U+4e2d, U+4ed6, U+4ee5, U+4f38, U+4f4d, U+500b, U+5024, U+5206, U+5225, U+524d, U+5316, U+540c, U+56e0, U+56e3, U+57fa, U+5909, U+5927, U+592e, U+5b9a, U+5bfe, U+5dee, U+5e03, U+5f8c, U+5fdc, U+62e1, U+63a8, U+63c3, U+6642, U+679c, U+67b6, U+6bd4, U+6e96, U+70b9, U+7834, U+79fb, U+7a7a, U+7b54, U+7dda, U+7fa9, U+884c, U+88fe, U+8c61, U+8f03, U+9577, U+9593, U+964d, U+96c6, U+9806, U+ff08-ff09;
}
移行後の応答時間分布は移行前と同じ形か。特に長い応答の裾はどれだけ変わったか。
横軸は移行前、縦軸は移行後の応答時間で、両方を同じ0〜140分尺度にする。同じパーセンタイルの分位値を点として配置し、y=xの破線に沿えば分布が一致する。破線より上なら同じ順位分位で移行後の時間が長く、距離が大きいほど差が広い。
架空例では中央値(p50)が22分から23分へほぼ変わらない一方、p90は45分から58分、p99は80分から130分へ広がる。これは個々の対応測定差を調べるBland–Altman plotでも、密度の山形を推定するviolin plotでもなく、分布同士の分位対応を比較するQ–Q plotである。架空データで、移行による因果を示さない。