As measured
1920 × 1080 Seen as a design The artboard itself, drawn live — sharp at any zoom Structure, margins and columns overlaid
1920 × 1080 Seen as a design The artboard itself, drawn live — sharp at any zoom Structure, margins and columns overlaid
Copy and paste, or save a file and hand it over. For a machine with no network, one “Everything” file is enough.
Everything in this panel, including the contents behind each URL, in one Markdown file — Large, so it goes as a file (copy is for 32 KB and under)
Produce one slide to the following specification.

- Canvas 1920 × 1080
- Margin top 96 right 140 bottom 96 left 140

## Type (px against a 1920px canvas)
title  44px / 700 / tracking 0.01em / leading 1.3
window  20px / 500 / leading 1.5
bandName  22px / 700 / leading 1.3
bandValue  24px / 700 / leading 1.2 / tabular numerals
axisLabel  20px / 500 / leading 1.4 / tabular numerals
forecastLabel  20px / 500 / leading 1.4
conclusion  26px / 500 / leading 1.6
note  16px / 400 / leading 1.6

## Colour
Ground #FFFFFF / Surface #F4F6F9 / Ink #131820 / Muted #667183 / Accent #1F5FA8 / Rule #DBE1E9 / #1C8C79 / #2F6FB5 / #9A6B12

## Constraints — dropping these breaks it
- Say that these are shares. A band can thin while its amount grows, if the total grew faster
- Three or four bands at most. Past five, thin bands stop showing their change, and the middle ones lose both their start and their end
- Keep the bands equal in strength. Darken one and the figure stops being a history and becomes an argument about that band
- Name and number the band that did not move. Read only for the handover, the figure loses the fact that something stayed put
- Mark a forecast period as a forecast. Drawn continuous with actuals, the final period reads as a commitment

Replace the content with [your content]. Keep the measurements and colours as given.
For an exact reproduction, use the verbatim HTML at https://design-vault.pages.dev/designs/stacked-area-share-shift/pattern.html.
/ai/designs/stacked-area-share-shift.json
format: slide-16x9
density: medium
layout:
  kind: timeline
  canvas:
    w: 1920
    h: 1080
  margin:
    top: 96
    right: 140
    bottom: 96
    left: 140
type:
  title:
    size: 44
    weight: 700
    tracking: 0.01em
    leading: 1.3
  window:
    size: 20
    weight: 500
    leading: 1.5
  bandName:
    size: 22
    weight: 700
    leading: 1.3
  bandValue:
    size: 24
    weight: 700
    leading: 1.2
    numeric: tabular
  axisLabel:
    size: 20
    weight: 500
    leading: 1.4
    numeric: tabular
  forecastLabel:
    size: 20
    weight: 500
    leading: 1.4
  conclusion:
    size: 26
    weight: 500
    leading: 1.6
  note:
    size: 16
    weight: 400
    leading: 1.6
colors:
  ground: "#FFFFFF"
  surface: "#F4F6F9"
  ink: "#131820"
  muted: "#667183"
  accent: "#1F5FA8"
  rule: "#DBE1E9"
  series:
    - "#1C8C79"
    - "#2F6FB5"
    - "#9A6B12"
rules:
  - Say that these are shares. A band can thin while its amount grows, if the total grew faster
  - Three or four bands at most. Past five, thin bands stop showing their change, and the middle ones lose both their start and their end
  - Keep the bands equal in strength. Darken one and the figure stops being a history and becomes an argument about that band
  - Name and number the band that did not move. Read only for the handover, the figure loses the fact that something stayed put
  - Mark a forecast period as a forecast. Drawn continuous with actuals, the final period reads as a commitment
{
"format": "slide-16x9",
"density": "medium",
"layout": {
"kind": "timeline",
"canvas": {
"w": 1920,
"h": 1080
},
"margin": {
"top": 96,
"right": 140,
"bottom": 96,
"left": 140
}
},
"type": {
"title": {
"size": 44,
"weight": 700,
"tracking": "0.01em",
"leading": 1.3
},
"window": {
"size": 20,
"weight": 500,
"leading": 1.5
},
"bandName": {
"size": 22,
"weight": 700,
"leading": 1.3
},
"bandValue": {
"size": 24,
"weight": 700,
"leading": 1.2,
"numeric": "tabular"
},
"axisLabel": {
"size": 20,
"weight": 500,
"leading": 1.4,
"numeric": "tabular"
},
"forecastLabel": {
"size": 20,
"weight": 500,
"leading": 1.4
},
"conclusion": {
"size": 26,
"weight": 500,
"leading": 1.6
},
"note": {
"size": 16,
"weight": 400,
"leading": 1.6
}
},
"colors": {
"ground": "#FFFFFF",
"surface": "#F4F6F9",
"ink": "#131820",
"muted": "#667183",
"accent": "#1F5FA8",
"rule": "#DBE1E9",
"series": [
"#1C8C79",
"#2F6FB5",
"#9A6B12"
]
},
"rules": [
"Say that these are shares. A band can thin while its amount grows, if the total grew faster",
"Three or four bands at most. Past five, thin bands stop showing their change, and the middle ones lose both their start and their end",
"Keep the bands equal in strength. Darken one and the figure stops being a history and becomes an argument about that band",
"Name and number the band that did not move. Read only for the handover, the figure loses the fact that something stayed put",
"Mark a forecast period as a forecast. Drawn continuous with actuals, the final period reads as a commitment"
]
} /designs/stacked-area-share-shift/pattern.html — The artboard itself, font subset included — open it and this picture draws.
<!doctype html>
<meta charset="utf-8">
<title>契約の構成比の推移 — 2 年で主力が入れ替わった</title>
<meta name="dv-font" content="Zen Kaku Gothic New:400;500;700">
<link rel="stylesheet" href="./font.css">
<style>
  /* 色のリテラルはこの :root にだけ置く。以下の規則は var() か color-mix() で名指す。
     区分色は 3 つ。構成比の図なので、帯ごとに色が要る —— ただし濃さは揃え、
     どれかを目立たせない(目立たせた瞬間、推移ではなく主張になる)。 */
  :root {
    --ground: #FFFFFF;
    --surface: #F4F6F9;
    --ink: #131820;
    --muted: #667183;
    --accent: #1F5FA8;
    --rule: #DBE1E9;
    --series-1: #1C8C79;
    --series-2: #2F6FB5;
    --series-3: #9A6B12;
  }

  * { box-sizing: border-box; margin: 0; }
  html, body { width: 1920px; height: 1080px; }
  body { font-family: "Zen Kaku Gothic New", "IPAGothic", sans-serif; }

  .artboard {
    width: 1920px;
    height: 1080px;
    background: var(--ground);
    color: var(--ink);
    padding: 96px 140px;
  }

  .content {
    height: 100%;
    display: grid;
    grid-template-rows: auto minmax(0, 1fr) auto;
  }

  .head { border-bottom: 2px solid var(--rule); padding-bottom: 28px; }
  .title { font-size: 44px; font-weight: 700; letter-spacing: 0.01em; line-height: 1.3; }
  .window { margin-top: 14px; font-size: 20px; font-weight: 500; line-height: 1.5; color: var(--muted); }

  .body {
    display: grid;
    grid-template-rows: auto auto;
    align-content: center;
    justify-items: center;
    row-gap: 28px;
  }

  .figure { display: block; }
  .band-1 { fill: color-mix(in srgb, var(--series-1) 26%, var(--ground)); }
  .band-2 { fill: color-mix(in srgb, var(--series-2) 30%, var(--ground)); }
  .band-3 { fill: color-mix(in srgb, var(--series-3) 24%, var(--ground)); }
  .divider { fill: none; stroke: var(--ground); stroke-width: 3; }
  .tick { stroke: var(--rule); stroke-width: 1.5; }
  .band-name { fill: var(--ink); font-size: 22px; font-weight: 700; line-height: 1.3; }
  .band-value { fill: var(--ink); font-size: 24px; font-weight: 700; line-height: 1.2; font-variant-numeric: tabular-nums; }
  .axis-label { fill: var(--muted); font-size: 20px; font-weight: 500; line-height: 1.4; font-variant-numeric: tabular-nums; }
  /* 実績と見込みの境目を図の中に引く。見出しに「見込み」と書くだけでは、
     最後の 1 期が実績と同じ線で続いているぶん、約束として読まれる。 */
  .forecast-line { fill: none; stroke: var(--muted); stroke-width: 2; stroke-dasharray: 8 6; }
  .forecast-label { fill: var(--muted); font-size: 20px; font-weight: 500; line-height: 1.4; }

  .conclusion { font-size: 26px; font-weight: 500; line-height: 1.6; color: var(--muted); }

  .foot { border-top: 1px solid var(--rule); padding-top: 22px; font-size: 16px; font-weight: 400; line-height: 1.6; color: var(--muted); }
</style>

<div class="artboard" data-artboard>
  <div class="content" data-content>
    <div class="head">
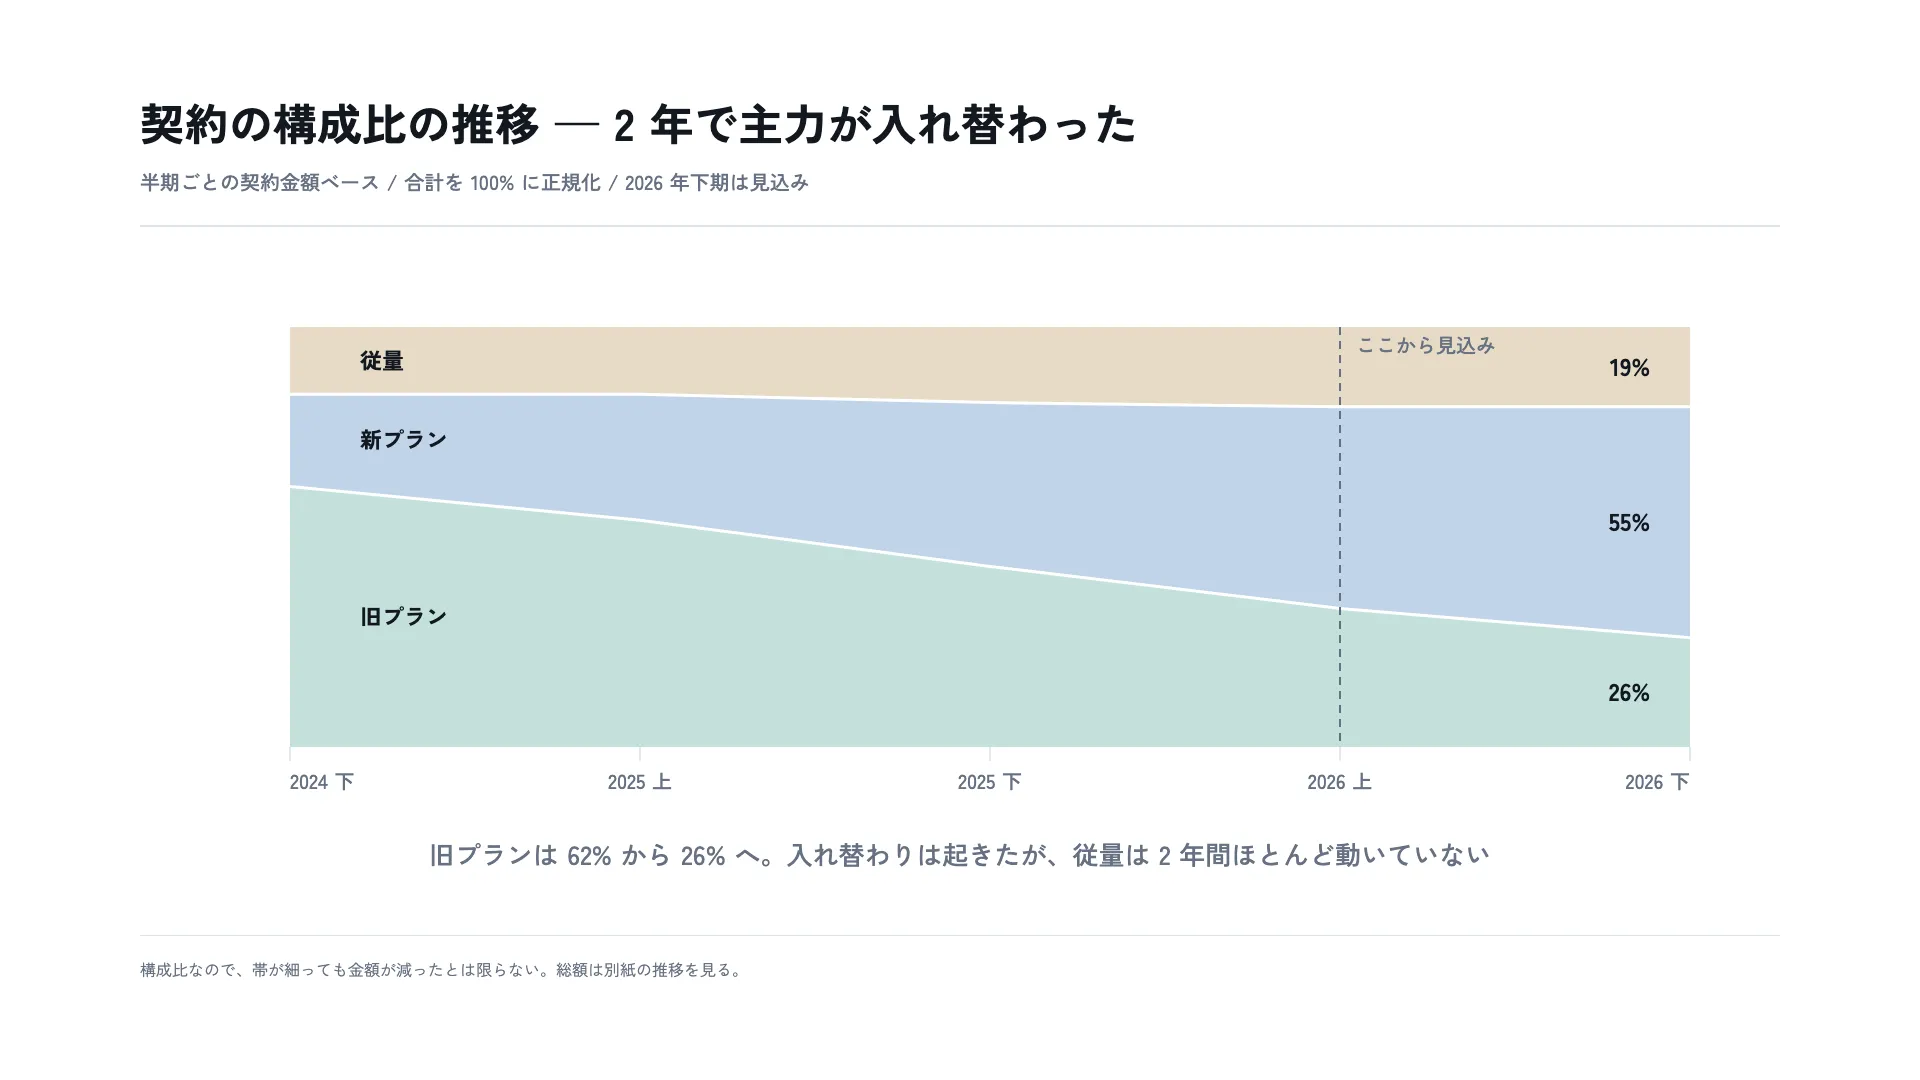
      <h1 class="title" data-type="title">契約の構成比の推移 — 2 年で主力が入れ替わった</h1>
      <p class="window" data-type="window">半期ごとの契約金額ベース / 合計を 100% に正規化 / 2026 年下期は見込み</p>
    </div>

    <div class="body">
      <!-- 等倍で描く。viewBox と width/height を一致させてあるので、
           SVG の中の文字の級数は版面の px とそのまま同じ数字になる。
           縦は 420px = 100%。どの帯の厚みもその比で、各時点の合計は必ず 100% になる。 -->
      <svg class="figure" width="1500" height="520" viewBox="0 0 1500 520">
        <polygon class="band-1" points="80,460 1480,460 1480,350.8 1130,321.4 780,279.4 430,233.2 80,199.6"/>
        <polygon class="band-2" points="80,199.6 430,233.2 780,279.4 1130,321.4 1480,350.8 1480,119.8 1130,119.8 780,115.6 430,107.2 80,107.2"/>
        <polygon class="band-3" points="80,107.2 430,107.2 780,115.6 1130,119.8 1480,119.8 1480,40 80,40"/>

        <path class="divider" d="M80 199.6L430 233.2L780 279.4L1130 321.4L1480 350.8M80 107.2L430 107.2L780 115.6L1130 119.8L1480 119.8"/>

        <path class="tick" d="M80 460v14M430 460v14M780 460v14M1130 460v14M1480 460v14"/>

        <path class="forecast-line" d="M1130 40v420"/>
        <text class="forecast-label" data-type="forecastLabel" x="1146" y="58" text-anchor="start" dominant-baseline="central">ここから見込み</text>

        <text class="band-name" data-type="bandName" x="150" y="330" text-anchor="start" dominant-baseline="central">旧プラン</text>
        <text class="band-name" x="150" y="153" text-anchor="start" dominant-baseline="central">新プラン</text>
        <text class="band-name" x="150" y="74" text-anchor="start" dominant-baseline="central">従量</text>

        <text class="band-value" data-type="bandValue" x="1440" y="405" text-anchor="end" dominant-baseline="central">26%</text>
        <text class="band-value" x="1440" y="235" text-anchor="end" dominant-baseline="central">55%</text>
        <text class="band-value" x="1440" y="80" text-anchor="end" dominant-baseline="central">19%</text>

        <text class="axis-label" data-type="axisLabel" x="80" y="494" text-anchor="start" dominant-baseline="central">2024 下</text>
        <text class="axis-label" x="430" y="494" text-anchor="middle" dominant-baseline="central">2025 上</text>
        <text class="axis-label" x="780" y="494" text-anchor="middle" dominant-baseline="central">2025 下</text>
        <text class="axis-label" x="1130" y="494" text-anchor="middle" dominant-baseline="central">2026 上</text>
        <text class="axis-label" x="1480" y="494" text-anchor="end" dominant-baseline="central">2026 下</text>
      </svg>

      <p class="conclusion" data-type="conclusion">旧プランは 62% から 26% へ。入れ替わりは起きたが、従量は 2 年間ほとんど動いていない</p>
    </div>

    <div class="foot" data-type="note">構成比なので、帯が細っても金額が減ったとは限らない。総額は別紙の推移を見る。</div>
  </div>
</div>
/designs/stacked-area-share-shift/font.css — Not in Everything
/* dv-subset v2 — generated by scripts/subset-font.mjs. Do not edit.
 * font    Zen Kaku Gothic New 400;500;700
 * chars   84 (31b1f7233e251181)
 *
 * pattern.html の文字だけを含む部分集合。描画時に外部へ取りに行かないよう同梱する。
 * 版の文字を変えたら取り直すこと — 忘れると足りない字が豆腐になる。
 * その取り忘れは pattern-entries.test.ts が上の指紋で検出する。
 */

@font-face {
  font-family: 'Zen Kaku Gothic New';
  font-style: normal;
  font-weight: 400;
  font-display: block;
  src: url(./font-0.woff2) format('woff2');
  unicode-range: U+25, U+2f-32, U+34-36, U+39, U+2014, U+3001-3002, U+3044, U+304b-304e, U+3053-3054, U+305f-3060, U+3063, U+3066-306b, U+306e-3071, U+3078-307d, U+307f, U+3082, U+3089-308c, U+308f, U+3092-3093, U+3099-309a, U+30b9-30ba, U+30d5-30da, U+30e9, U+30f3, U+30fc, U+4e0a-4e0b, U+4e3b, U+5165, U+5225, U+529b, U+52d5, U+5316, U+534a, U+5408, U+5951, U+5e2f, U+5e74, U+5f93, U+6210, U+63a8, U+65b0, U+65e7, U+66ff, U+671f, U+69cb, U+6b63, U+6bd4, U+6e1b, U+79fb, U+7d04, U+7d19, U+7d30, U+7dcf, U+898b, U+898f, U+8a08, U+8d77, U+8fbc, U+91cf, U+91d1, U+9593, U+9650, U+984d;
}
@font-face {
  font-family: 'Zen Kaku Gothic New';
  font-style: normal;
  font-weight: 500;
  font-display: block;
  src: url(./font-1.woff2) format('woff2');
  unicode-range: U+25, U+2f-32, U+34-36, U+39, U+2014, U+3001-3002, U+3044, U+304b-304e, U+3053-3054, U+305f-3060, U+3063, U+3066-306b, U+306e-3071, U+3078-307d, U+307f, U+3082, U+3089-308c, U+308f, U+3092-3093, U+3099-309a, U+30b9-30ba, U+30d5-30da, U+30e9, U+30f3, U+30fc, U+4e0a-4e0b, U+4e3b, U+5165, U+5225, U+529b, U+52d5, U+5316, U+534a, U+5408, U+5951, U+5e2f, U+5e74, U+5f93, U+6210, U+63a8, U+65b0, U+65e7, U+66ff, U+671f, U+69cb, U+6b63, U+6bd4, U+6e1b, U+79fb, U+7d04, U+7d19, U+7d30, U+7dcf, U+898b, U+898f, U+8a08, U+8d77, U+8fbc, U+91cf, U+91d1, U+9593, U+9650, U+984d;
}
@font-face {
  font-family: 'Zen Kaku Gothic New';
  font-style: normal;
  font-weight: 700;
  font-display: block;
  src: url(./font-2.woff2) format('woff2');
  unicode-range: U+25, U+2f-32, U+34-36, U+39, U+2014, U+3001-3002, U+3044, U+304b-304e, U+3053-3054, U+305f-3060, U+3063, U+3066-306b, U+306e-3071, U+3078-307d, U+307f, U+3082, U+3089-308c, U+308f, U+3092-3093, U+3099-309a, U+30b9-30ba, U+30d5-30da, U+30e9, U+30f3, U+30fc, U+4e0a-4e0b, U+4e3b, U+5165, U+5225, U+529b, U+52d5, U+5316, U+534a, U+5408, U+5951, U+5e2f, U+5e74, U+5f93, U+6210, U+63a8, U+65b0, U+65e7, U+66ff, U+671f, U+69cb, U+6b63, U+6bd4, U+6e1b, U+79fb, U+7d04, U+7d19, U+7d30, U+7dcf, U+898b, U+898f, U+8a08, U+8d77, U+8fbc, U+91cf, U+91d1, U+9593, U+9650, U+984d;
}
構成比の推移で見落とされるのは、動かなかった帯である。目は入れ替わる 2 本を 追い、変わらない 1 本は背景になる。けれど「2 年間なにをしても動かなかった」は、 入れ替わりと同じくらい強い事実である。
正規化していることを明記するのも同じ理由で、帯が細ったことと金額が減ったことは まったく別である。総額が伸びていれば、細った帯の金額はむしろ増えている。