As measured
1920 × 1080 Seen as a design The artboard itself, drawn live — sharp at any zoom Structure, margins and columns overlaid
1920 × 1080 Seen as a design The artboard itself, drawn live — sharp at any zoom Structure, margins and columns overlaid
Copy and paste, or save a file and hand it over. For a machine with no network, one “Everything” file is enough.
Everything in this panel, including the contents behind each URL, in one Markdown file — Large, so it goes as a file (copy is for 32 KB and under)
Produce one slide to the following specification.

- Canvas 1920 × 1080
- Margin top 96 right 140 bottom 96 left 140

## Type (px against a 1920px canvas)
title  44px / 700 / tracking 0.01em / leading 1.3
window  20px / 500 / leading 1.5
tileName  22px / 700 / leading 1.3
tileValue  28px / 700 / leading 1.2 / tabular numerals
scaleTitle  22px / 700 / leading 1.4
scaleEnd  20px / 500 / leading 1.4 / tabular numerals
reading  24px / 400 / leading 1.7
note  16px / 400 / leading 1.6

## Colour
Ground #FFFFFF / Surface #F4F6F9 / Ink #131820 / Muted #667183 / Accent #1F5FA8 / Rule #DBE1E9

## Constraints — dropping these breaks it
- Keep every tile the same size. On a real map, area reads as quantity and the land's own size — neither population nor revenue — enters the figure
- Do not colour the regions apart. Eight regions are not eight categories but one quantity's distribution; separate hues make them read as separate things
- Let the arrangement echo the real one. If it cannot, use a table: a table shaped like a map betrays the eye that came to read geography
- Five steps of strength at most. Beyond that, neighbouring shades stop being distinguishable and the map becomes a texture
- Note the base alongside a rate. One point of a percentage weighs differently in regions with different denominators

Replace the content with [your content]. Keep the measurements and colours as given.
For an exact reproduction, use the verbatim HTML at https://design-vault.pages.dev/designs/tile-map-japan-regions/pattern.html.
/ai/designs/tile-map-japan-regions.json
format: slide-16x9
density: medium
layout:
  kind: map
  canvas:
    w: 1920
    h: 1080
  margin:
    top: 96
    right: 140
    bottom: 96
    left: 140
type:
  title:
    size: 44
    weight: 700
    tracking: 0.01em
    leading: 1.3
  window:
    size: 20
    weight: 500
    leading: 1.5
  tileName:
    size: 22
    weight: 700
    leading: 1.3
  tileValue:
    size: 28
    weight: 700
    leading: 1.2
    numeric: tabular
  scaleTitle:
    size: 22
    weight: 700
    leading: 1.4
  scaleEnd:
    size: 20
    weight: 500
    leading: 1.4
    numeric: tabular
  reading:
    size: 24
    weight: 400
    leading: 1.7
  note:
    size: 16
    weight: 400
    leading: 1.6
colors:
  ground: "#FFFFFF"
  surface: "#F4F6F9"
  ink: "#131820"
  muted: "#667183"
  accent: "#1F5FA8"
  rule: "#DBE1E9"
rules:
  - Keep every tile the same size. On a real map, area reads as quantity and the land's own size — neither population nor revenue — enters the figure
  - Do not colour the regions apart. Eight regions are not eight categories but one quantity's distribution; separate hues make them read as separate things
  - "Let the arrangement echo the real one. If it cannot, use a table: a table shaped like a map betrays the eye that came to read geography"
  - Five steps of strength at most. Beyond that, neighbouring shades stop being distinguishable and the map becomes a texture
  - Note the base alongside a rate. One point of a percentage weighs differently in regions with different denominators
{
"format": "slide-16x9",
"density": "medium",
"layout": {
"kind": "map",
"canvas": {
"w": 1920,
"h": 1080
},
"margin": {
"top": 96,
"right": 140,
"bottom": 96,
"left": 140
}
},
"type": {
"title": {
"size": 44,
"weight": 700,
"tracking": "0.01em",
"leading": 1.3
},
"window": {
"size": 20,
"weight": 500,
"leading": 1.5
},
"tileName": {
"size": 22,
"weight": 700,
"leading": 1.3
},
"tileValue": {
"size": 28,
"weight": 700,
"leading": 1.2,
"numeric": "tabular"
},
"scaleTitle": {
"size": 22,
"weight": 700,
"leading": 1.4
},
"scaleEnd": {
"size": 20,
"weight": 500,
"leading": 1.4,
"numeric": "tabular"
},
"reading": {
"size": 24,
"weight": 400,
"leading": 1.7
},
"note": {
"size": 16,
"weight": 400,
"leading": 1.6
}
},
"colors": {
"ground": "#FFFFFF",
"surface": "#F4F6F9",
"ink": "#131820",
"muted": "#667183",
"accent": "#1F5FA8",
"rule": "#DBE1E9"
},
"rules": [
"Keep every tile the same size. On a real map, area reads as quantity and the land's own size — neither population nor revenue — enters the figure",
"Do not colour the regions apart. Eight regions are not eight categories but one quantity's distribution; separate hues make them read as separate things",
"Let the arrangement echo the real one. If it cannot, use a table: a table shaped like a map betrays the eye that came to read geography",
"Five steps of strength at most. Beyond that, neighbouring shades stop being distinguishable and the map becomes a texture",
"Note the base alongside a rate. One point of a percentage weighs differently in regions with different denominators"
]
} /designs/tile-map-japan-regions/pattern.html — The artboard itself, font subset included — open it and this picture draws.
<!doctype html>
<meta charset="utf-8">
<title>地域別の導入率 — 西ほど高く、関東が最も低い</title>
<meta name="dv-font" content="Zen Kaku Gothic New:400;500;700">
<link rel="stylesheet" href="./font.css">
<style>
  /* 色のリテラルはこの :root にだけ置く。以下の規則は var() か color-mix() で名指す。
     区分色は持たない —— 8 地域は 8 種類ではなく 1 つの量の分布なので、色を分けると
     「地域ごとに違う何か」に見える。濃さだけで量を示す。 */
  :root {
    --ground: #FFFFFF;
    --surface: #F4F6F9;
    --ink: #131820;
    --muted: #667183;
    --accent: #1F5FA8;
    --rule: #DBE1E9;
  }

  * { box-sizing: border-box; margin: 0; }
  html, body { width: 1920px; height: 1080px; }
  body { font-family: "Zen Kaku Gothic New", "IPAGothic", sans-serif; }

  .artboard {
    width: 1920px;
    height: 1080px;
    background: var(--ground);
    color: var(--ink);
    padding: 96px 140px;
  }

  .content {
    height: 100%;
    display: grid;
    grid-template-rows: auto minmax(0, 1fr) auto;
  }

  .head { border-bottom: 2px solid var(--rule); padding-bottom: 28px; }
  .title { font-size: 44px; font-weight: 700; letter-spacing: 0.01em; line-height: 1.3; }
  .window { margin-top: 14px; font-size: 20px; font-weight: 500; line-height: 1.5; color: var(--muted); }

  .body { display: grid; grid-template-columns: 640px minmax(0, 1fr); gap: 110px; align-items: center; }

  /* 同じ大きさの正方を、実際の土地の並びに似せて置く。面積は情報を持たない
     —— 面積が量だと読まれると、人口でも売上でもない「地域の広さ」が混ざる。 */
  .tiles { display: grid; grid-template-columns: repeat(5, 120px); grid-template-rows: repeat(5, 120px); gap: 10px; }
  .tile { border-radius: 8px; display: grid; place-content: center; text-align: center; }
  /* 濃さは 5 段階に丸める。8 地域ぶんの濃さを別々に作ると、凡例の 5 つと
     照らし合わせられない色がタイルに現れる。正確な値はタイルの数字が持つ。 */
  .s1 { background: color-mix(in srgb, var(--accent) 8%, var(--ground)); }
  .s2 { background: color-mix(in srgb, var(--accent) 20%, var(--ground)); }
  .s3 { background: color-mix(in srgb, var(--accent) 32%, var(--ground)); }
  .s4 { background: color-mix(in srgb, var(--accent) 44%, var(--ground)); }
  .s5 { background: color-mix(in srgb, var(--accent) 56%, var(--ground)); }
  .tile-name { font-size: 22px; font-weight: 700; line-height: 1.3; }
  .tile-value { margin-top: 6px; font-size: 28px; font-weight: 700; line-height: 1.2; font-variant-numeric: tabular-nums; }

  .scale-title { font-size: 22px; font-weight: 700; line-height: 1.4; }
  .scale { margin-top: 16px; display: flex; gap: 6px; }
  .swatch { width: 62px; height: 28px; border-radius: 4px; }
  .scale-ends { margin-top: 10px; display: flex; justify-content: space-between; width: 340px; }
  .scale-end { font-size: 20px; font-weight: 500; line-height: 1.4; color: var(--muted); font-variant-numeric: tabular-nums; }
  .reading { margin-top: 40px; font-size: 24px; font-weight: 400; line-height: 1.7; color: var(--muted); }

  .foot { border-top: 1px solid var(--rule); padding-top: 22px; font-size: 16px; font-weight: 400; line-height: 1.6; color: var(--muted); }
</style>

<div class="artboard" data-artboard>
  <div class="content" data-content>
    <div class="head">
      <h1 class="title" data-type="title">地域別の導入率 — 西ほど高く、関東が最も低い</h1>
      <p class="window" data-type="window">2026 年 9 月末時点 / 対象は法人契約のみ / 濃さが導入率</p>
    </div>

    <div class="body">
      <div class="tiles">
        <div class="tile s2" style="grid-column: 5; grid-row: 1">
          <span class="tile-name" data-type="tileName">北海道</span>
          <span class="tile-value" data-type="tileValue">18%</span>
        </div>
        <div class="tile s2" style="grid-column: 4; grid-row: 2">
          <span class="tile-name">東北</span>
          <span class="tile-value">22%</span>
        </div>
        <div class="tile s1" style="grid-column: 4; grid-row: 3">
          <span class="tile-name">関東</span>
          <span class="tile-value">11%</span>
        </div>
        <div class="tile s3" style="grid-column: 3; grid-row: 4">
          <span class="tile-name">中部</span>
          <span class="tile-value">27%</span>
        </div>
        <div class="tile s4" style="grid-column: 2; grid-row: 4">
          <span class="tile-name">近畿</span>
          <span class="tile-value">34%</span>
        </div>
        <div class="tile s4" style="grid-column: 1; grid-row: 4">
          <span class="tile-name">中国</span>
          <span class="tile-value">38%</span>
        </div>
        <div class="tile s5" style="grid-column: 2; grid-row: 5">
          <span class="tile-name">四国</span>
          <span class="tile-value">41%</span>
        </div>
        <div class="tile s5" style="grid-column: 1; grid-row: 5">
          <span class="tile-name">九州</span>
          <span class="tile-value">45%</span>
        </div>
      </div>

      <div class="side">
        <div class="scale-title" data-type="scaleTitle">濃さ = 導入率</div>
        <div class="scale">
          <span class="swatch s1"></span>
          <span class="swatch s2"></span>
          <span class="swatch s3"></span>
          <span class="swatch s4"></span>
          <span class="swatch s5"></span>
        </div>
        <div class="scale-ends">
          <span class="scale-end" data-type="scaleEnd">11%</span>
          <span class="scale-end">45%</span>
        </div>
        <p class="reading" data-type="reading">最も高い九州と最も低い関東の差は 4 倍。関東は契約社数が最大なので、同じ 1 ポイントの重みが他の地域と違う。</p>
      </div>
    </div>

    <div class="foot" data-type="note">地域区分は総務省の 8 区分。タイルの大きさは情報を持たない。濃さは 5 段階に丸めてあるので、正確な値はタイルの数字を見る。</div>
  </div>
</div>
/designs/tile-map-japan-regions/font.css — Not in Everything
/* dv-subset v2 — generated by scripts/subset-font.mjs. Do not edit.
 * font    Zen Kaku Gothic New 400;500;700
 * chars   105 (40d6793ee2492e76)
 *
 * pattern.html の文字だけを含む部分集合。描画時に外部へ取りに行かないよう同梱する。
 * 版の文字を変えたら取り直すこと — 忘れると足りない字が豆腐になる。
 * その取り忘れは pattern-entries.test.ts が上の指紋で検出する。
 */

@font-face {
  font-family: 'Zen Kaku Gothic New';
  font-style: normal;
  font-weight: 400;
  font-display: block;
  src: url(./font-0.woff2) format('woff2');
  unicode-range: U+25, U+2f-39, U+3d, U+2014, U+3001-3002, U+3042, U+3044, U+3046, U+304b-3050, U+3055-3058, U+305f-3060, U+3066-306b, U+306e-3071, U+307b-307d, U+307f, U+3081-3082, U+308b, U+3092, U+3094, U+3099-309a, U+30a4, U+30bf-30c0, U+30c8-30c9, U+30db-30dd, U+30eb, U+30f3, U+4e2d, U+4e38, U+4e5d, U+4eba, U+4ed6, U+4f4e, U+500d, U+5024, U+5165, U+5206, U+5225, U+52d9, U+5317, U+533a, U+540c, U+56db, U+56fd, U+5730, U+57df, U+5831, U+5927, U+5951, U+5b57, U+5bfe, U+5c0e, U+5dde, U+5dee, U+5e74, U+60c5, U+6301, U+6570, U+6642, U+6700, U+6708, U+672b, U+6771, U+6b63, U+6bb5, U+6cd5, U+6d77, U+6fc3, U+70b9, U+7387, U+757f, U+7701, U+78ba, U+793e, U+7d04, U+7dcf, U+897f, U+898b, U+8c61, U+8fd1, U+9053, U+9055, U+90e8, U+91cd, U+95a2, U+968e, U+9ad8;
}
@font-face {
  font-family: 'Zen Kaku Gothic New';
  font-style: normal;
  font-weight: 500;
  font-display: block;
  src: url(./font-1.woff2) format('woff2');
  unicode-range: U+25, U+2f-39, U+3d, U+2014, U+3001-3002, U+3042, U+3044, U+3046, U+304b-3050, U+3055-3058, U+305f-3060, U+3066-306b, U+306e-3071, U+307b-307d, U+307f, U+3081-3082, U+308b, U+3092, U+3094, U+3099-309a, U+30a4, U+30bf-30c0, U+30c8-30c9, U+30db-30dd, U+30eb, U+30f3, U+4e2d, U+4e38, U+4e5d, U+4eba, U+4ed6, U+4f4e, U+500d, U+5024, U+5165, U+5206, U+5225, U+52d9, U+5317, U+533a, U+540c, U+56db, U+56fd, U+5730, U+57df, U+5831, U+5927, U+5951, U+5b57, U+5bfe, U+5c0e, U+5dde, U+5dee, U+5e74, U+60c5, U+6301, U+6570, U+6642, U+6700, U+6708, U+672b, U+6771, U+6b63, U+6bb5, U+6cd5, U+6d77, U+6fc3, U+70b9, U+7387, U+757f, U+7701, U+78ba, U+793e, U+7d04, U+7dcf, U+897f, U+898b, U+8c61, U+8fd1, U+9053, U+9055, U+90e8, U+91cd, U+95a2, U+968e, U+9ad8;
}
@font-face {
  font-family: 'Zen Kaku Gothic New';
  font-style: normal;
  font-weight: 700;
  font-display: block;
  src: url(./font-2.woff2) format('woff2');
  unicode-range: U+25, U+2f-39, U+3d, U+2014, U+3001-3002, U+3042, U+3044, U+3046, U+304b-3050, U+3055-3058, U+305f-3060, U+3066-306b, U+306e-3071, U+307b-307d, U+307f, U+3081-3082, U+308b, U+3092, U+3094, U+3099-309a, U+30a4, U+30bf-30c0, U+30c8-30c9, U+30db-30dd, U+30eb, U+30f3, U+4e2d, U+4e38, U+4e5d, U+4eba, U+4ed6, U+4f4e, U+500d, U+5024, U+5165, U+5206, U+5225, U+52d9, U+5317, U+533a, U+540c, U+56db, U+56fd, U+5730, U+57df, U+5831, U+5927, U+5951, U+5b57, U+5bfe, U+5c0e, U+5dde, U+5dee, U+5e74, U+60c5, U+6301, U+6570, U+6642, U+6700, U+6708, U+672b, U+6771, U+6b63, U+6bb5, U+6cd5, U+6d77, U+6fc3, U+70b9, U+7387, U+757f, U+7701, U+78ba, U+793e, U+7d04, U+7dcf, U+897f, U+898b, U+8c61, U+8fd1, U+9053, U+9055, U+90e8, U+91cd, U+95a2, U+968e, U+9ad8;
}
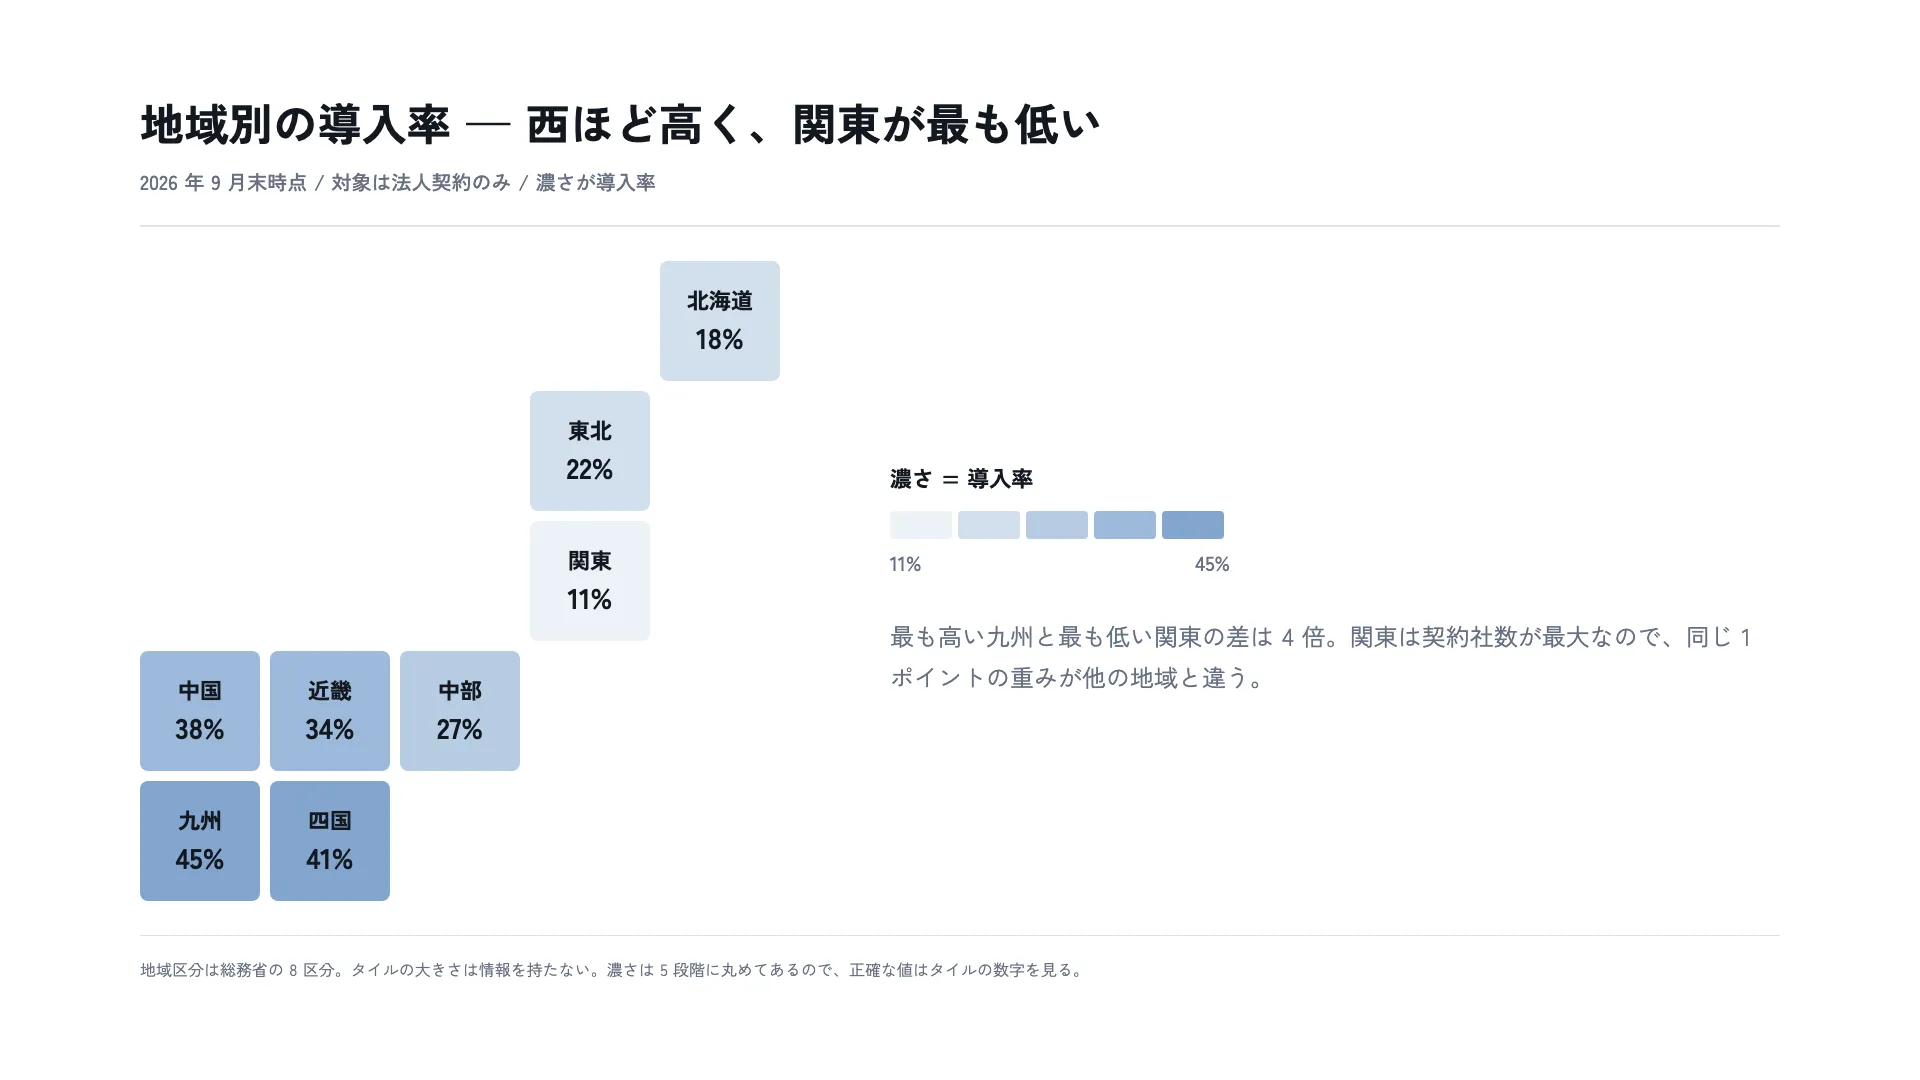
地図で量を示すとき、いちばん邪魔をするのは土地の広さである。北海道は広く、 香川は狭い。実際の形で塗ると、面積の差が量の差として目に入り、読み手は 訂正できない。
タイル地図はその広さを捨てる。捨てた結果として残るのは位置だけで、 「西ほど高い」のような地理的な傾向は、むしろはっきり見える。